## Flowchart: Process of Tokenization, Generation, and Evaluation
### Overview
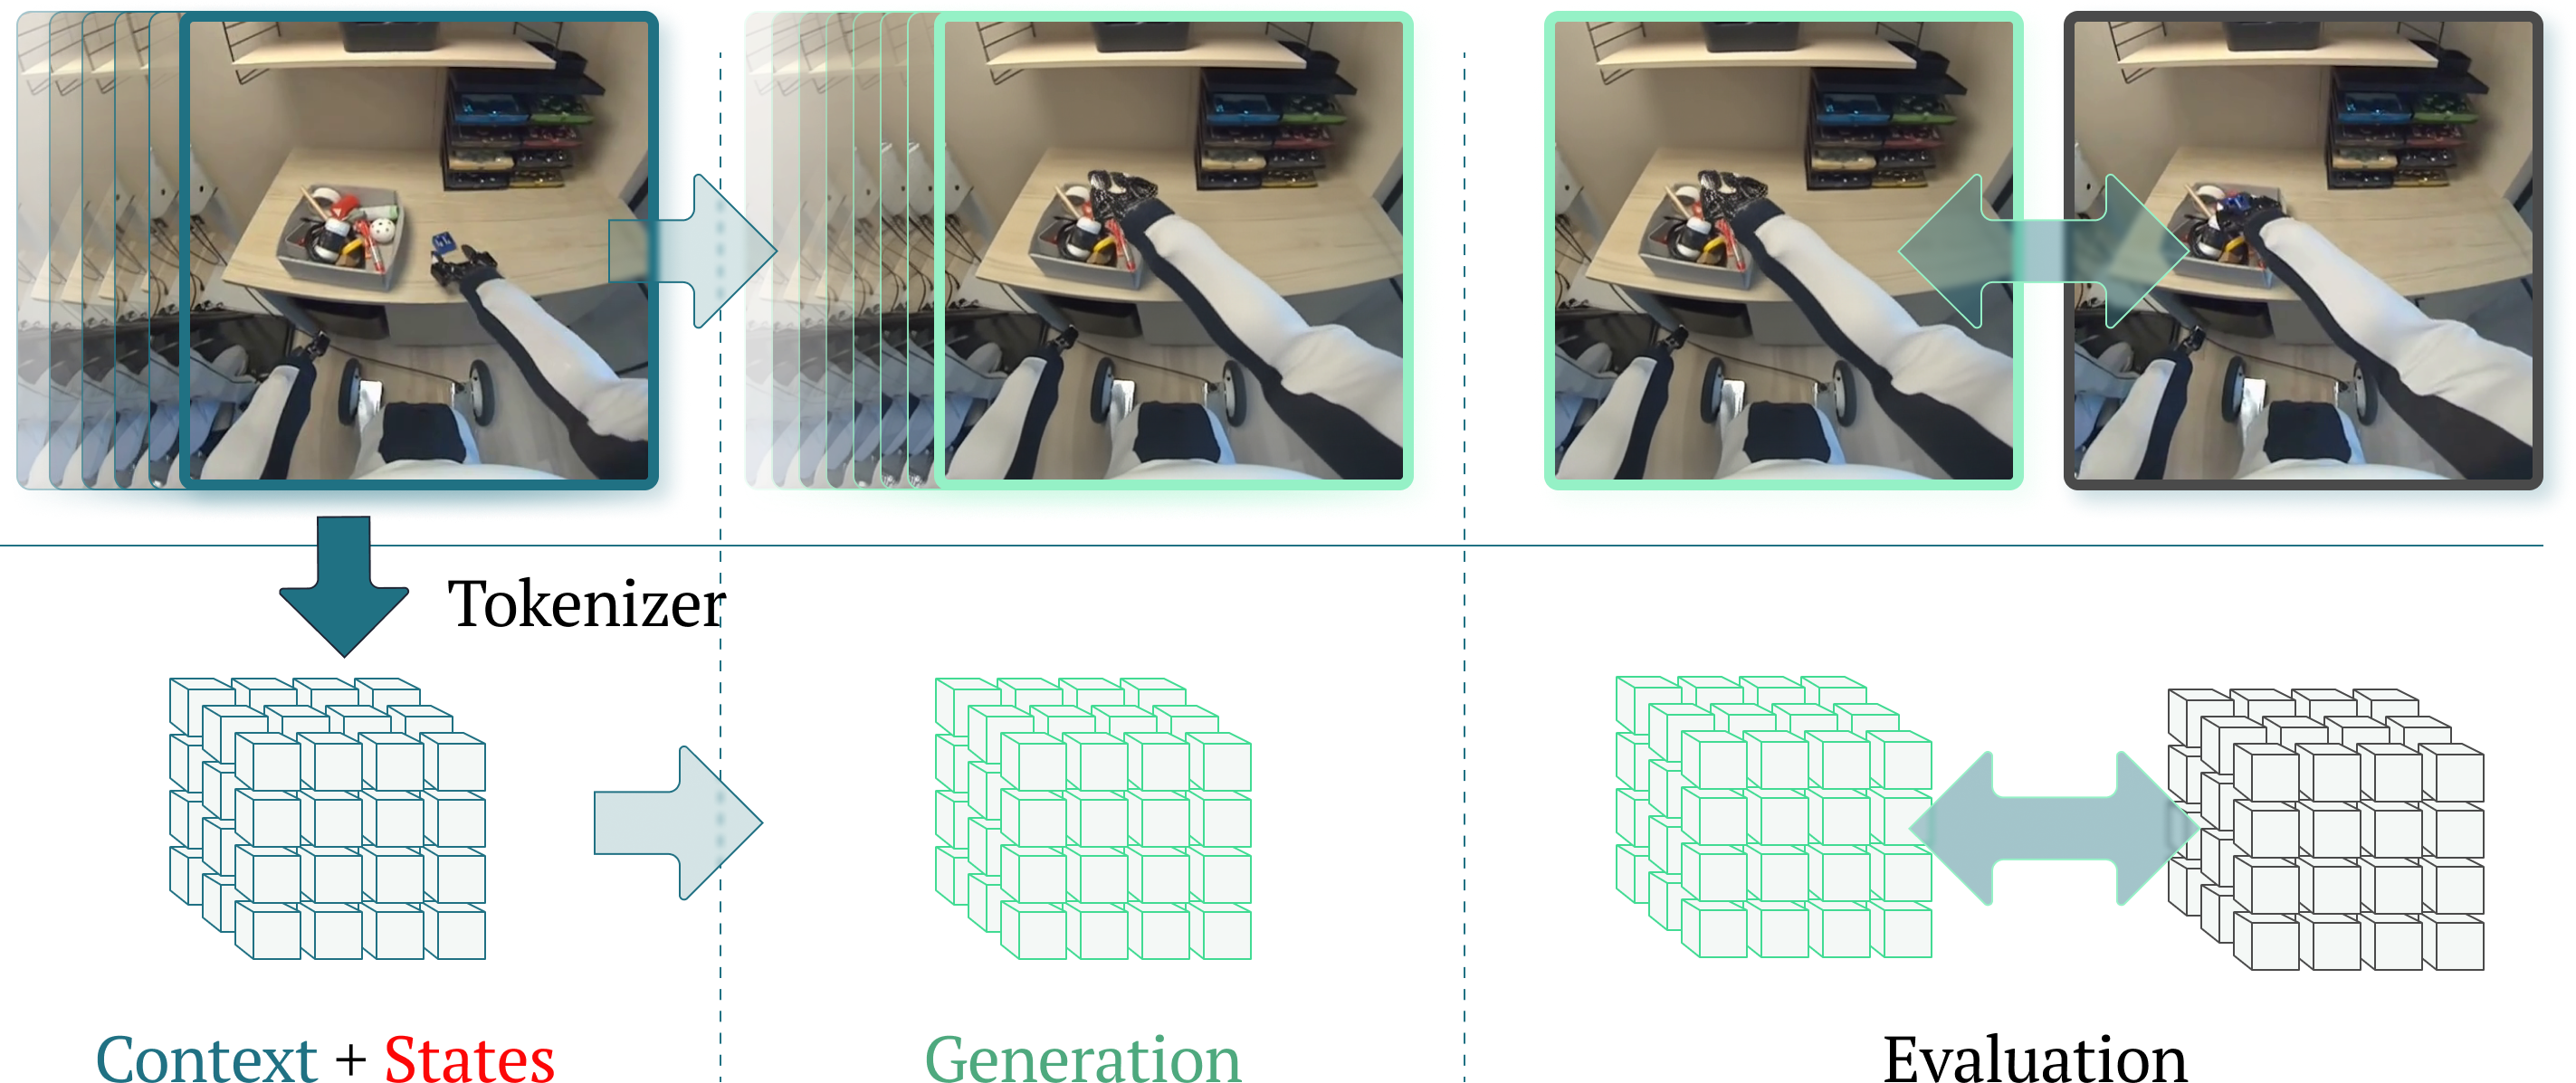
The image depicts a sequential workflow involving three stages: **Context + States**, **Generation**, and **Evaluation**. Each stage is represented by a 3D cube structure, with directional arrows indicating the flow of data or processes. The diagram uses color-coded arrows (teal, green, blue) to differentiate stages and includes a "Tokenizer" component as a bridge between the first and second stages.
### Components/Axes
- **Sections**:
1. **Context + States**: A teal arrow points to a 3D cube labeled "Context + States".
2. **Tokenizer**: A green arrow labeled "Tokenizer" connects the first cube to the second.
3. **Generation**: A green cube labeled "Generation" follows the Tokenizer.
4. **Evaluation**: A blue arrow connects "Generation" to a third cube labeled "Evaluation".
- **Arrows**:
- Teal (Context + States → Tokenizer)
- Green (Tokenizer → Generation)
- Blue (Generation → Evaluation)
- **Cubes**:
- 3D structures with grid-like patterns, representing data or state complexity.
- The first and third cubes have more visible layers than the second.
### Detailed Analysis
- **Context + States**:
- A teal arrow originates from the left, pointing to a 3D cube.
- The cube is labeled "Context + States" in black text.
- **Tokenizer**:
- A green arrow labeled "Tokenizer" connects the first cube to the second.
- The second cube is labeled "Generation" in black text.
- **Generation**:
- A green cube with a grid pattern, labeled "Generation".
- A blue arrow extends from this cube to the third section.
- **Evaluation**:
- A blue arrow points to a third 3D cube labeled "Evaluation".
- This cube has a similar grid pattern but appears slightly larger than the first.
### Key Observations
1. **Sequential Flow**: The process is linear, with each stage directly feeding into the next.
2. **Data Complexity**: The first and third cubes (Context + States and Evaluation) have more visible layers, suggesting higher complexity or data volume.
3. **Color Coding**: Arrows and cubes use distinct colors (teal, green, blue) to differentiate stages.
4. **No Numerical Data**: The diagram lacks explicit numerical values, focusing on structural relationships.
### Interpretation
The flowchart illustrates a workflow where **Context + States** are processed through a **Tokenizer** to generate intermediate data ("Generation"), which is then evaluated. The increasing complexity of the cubes in the first and third stages implies that both the initial context and the final evaluation involve more detailed or layered data. The "Tokenizer" acts as a critical intermediary, transforming raw context into a format suitable for generation. The absence of numerical data suggests the diagram emphasizes process flow over quantitative metrics.