## Bar Chart: Accuracy of LLM and PRM Combinations on MATH500
### Overview
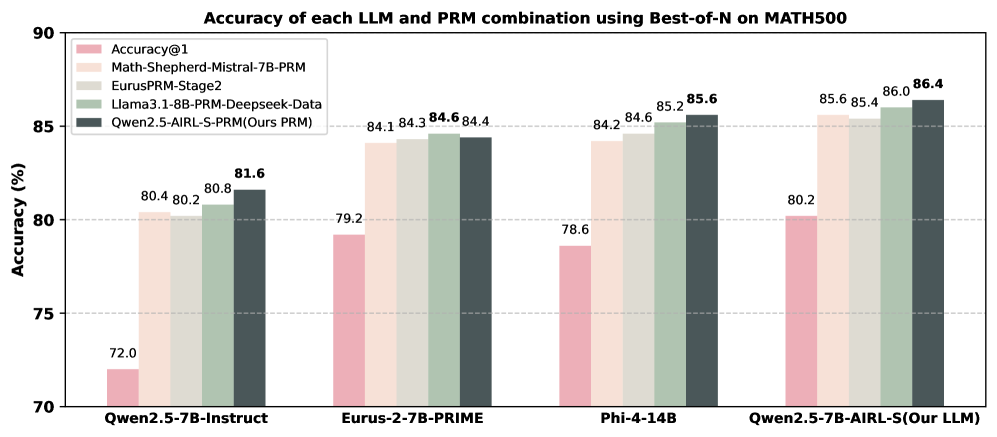
This is a grouped bar chart comparing the accuracy (in percentage) of four different Large Language Models (LLMs) when paired with five different Process Reward Models (PRMs) using a "Best-of-N" sampling strategy on the MATH500 benchmark. The chart demonstrates the performance uplift achieved by using various PRMs compared to the base model's accuracy (Accuracy@1).
### Components/Axes
* **Chart Title:** "Accuracy of each LLM and PRM combination using Best-of-N on MATH500"
* **Y-Axis:** Labeled "Accuracy (%)". The scale runs from 70 to 90, with major gridlines at intervals of 5% (70, 75, 80, 85, 90).
* **X-Axis:** Lists four distinct LLM models. From left to right:
1. `Qwen2.5-7B-Instruct`
2. `Eurus-2-7B-PRIME`
3. `Phi-4-14B`
4. `Qwen2.5-7B-AIRL-S (Our LLM)`
* **Legend:** Positioned in the top-left corner of the chart area. It defines five data series (PRM types) by color:
* **Pink:** `Accuracy@1` (This represents the baseline accuracy of the LLM alone, without using a PRM for Best-of-N sampling).
* **Light Beige:** `Math-Shepherd-Mistral-7B-PRM`
* **Light Gray:** `EurusPRM-Stage2`
* **Light Green:** `Llama3.1-8B-PRM-Deepseek-Data`
* **Dark Gray:** `Qwen2.5-AIRL-S-PRM (Ours PRM)`
### Detailed Analysis
The chart presents data for four LLM groups, each containing five bars corresponding to the PRMs in the legend. Values are extracted by matching bar color to the legend and reading the data label above each bar.
**1. LLM: Qwen2.5-7B-Instruct**
* **Trend:** All PRM combinations show a significant accuracy increase over the baseline.
* **Data Points (from left to right within the group):**
* Accuracy@1 (Pink): **72.0%**
* Math-Shepherd-Mistral-7B-PRM (Light Beige): **80.4%**
* EurusPRM-Stage2 (Light Gray): **80.2%**
* Llama3.1-8B-PRM-Deepseek-Data (Light Green): **80.8%**
* Qwen2.5-AIRL-S-PRM (Dark Gray): **81.6%**
**2. LLM: Eurus-2-7B-PRIME**
* **Trend:** Baseline accuracy is higher than the first model. All PRMs provide a substantial boost, with three PRMs achieving very similar high scores.
* **Data Points:**
* Accuracy@1 (Pink): **79.2%**
* Math-Shepherd-Mistral-7B-PRM (Light Beige): **84.1%**
* EurusPRM-Stage2 (Light Gray): **84.3%**
* Llama3.1-8B-PRM-Deepseek-Data (Light Green): **84.6%**
* Qwen2.5-AIRL-S-PRM (Dark Gray): **84.4%**
**3. LLM: Phi-4-14B**
* **Trend:** Similar pattern to the second group. The baseline is slightly lower, but the PRM-enhanced accuracies are among the highest in the chart.
* **Data Points:**
* Accuracy@1 (Pink): **78.6%**
* Math-Shepherd-Mistral-7B-PRM (Light Beige): **84.2%**
* EurusPRM-Stage2 (Light Gray): **84.6%**
* Llama3.1-8B-PRM-Deepseek-Data (Light Green): **85.2%**
* Qwen2.5-AIRL-S-PRM (Dark Gray): **85.6%**
**4. LLM: Qwen2.5-7B-AIRL-S (Our LLM)**
* **Trend:** This model shows the highest baseline and achieves the highest overall accuracies with PRMs. The performance gap between the top three PRMs is very narrow.
* **Data Points:**
* Accuracy@1 (Pink): **80.2%**
* Math-Shepherd-Mistral-7B-PRM (Light Beige): **85.6%**
* EurusPRM-Stage2 (Light Gray): **85.4%**
* Llama3.1-8B-PRM-Deepseek-Data (Light Green): **86.0%**
* Qwen2.5-AIRL-S-PRM (Dark Gray): **86.4%**
### Key Observations
1. **Universal PRM Benefit:** For every LLM, using any PRM with Best-of-N sampling dramatically improves accuracy over the baseline (Accuracy@1). The smallest observed improvement is +8.2 percentage points (for Eurus-2-7B-PRIME with Math-Shepherd), and the largest is +9.6 points (for Qwen2.5-7B-Instruct with Qwen2.5-AIRL-S-PRM).
2. **Consistent Top Performer:** The dark gray bar (`Qwen2.5-AIRL-S-PRM (Ours PRM)`) is the highest or tied for the highest in every LLM group. Its lead is most pronounced with the `Qwen2.5-7B-Instruct` model.
3. **Model-PRM Synergy:** The highest absolute accuracy (86.4%) is achieved by the combination of the authors' own LLM (`Qwen2.5-7B-AIRL-S`) and their own PRM (`Qwen2.5-AIRL-S-PRM`), suggesting a potential synergistic effect.
4. **Clustering of High-Performing PRMs:** In the three rightmost LLM groups, the top three PRMs (Light Gray, Light Green, Dark Gray) often cluster within 1.0 percentage point of each other, indicating similar efficacy for those models on this benchmark.
### Interpretation
This chart provides strong empirical evidence for the effectiveness of using Process Reward Models (PRMs) with a Best-of-N sampling strategy to enhance the mathematical problem-solving accuracy of LLMs on the MATH500 benchmark. The data suggests that the choice of PRM matters, but the performance of several advanced PRMs (EurusPRM-Stage2, Llama3.1-8B-PRM-Deepseek-Data, and Qwen2.5-AIRL-S-PRM) is closely matched across different base models.
The most significant finding is the consistent top performance of the `Qwen2.5-AIRL-S-PRM`, which the authors label as "Ours PRM." This implies the chart is likely from a research paper or technical report introducing this new PRM. The chart's purpose is to validate their model by showing it either matches or exceeds the performance of existing state-of-the-art PRMs across a variety of LLM backbones. The peak performance of their own LLM-PRM combination further strengthens the claim of a well-optimized system. The clear visual message is that their proposed method (`Qwen2.5-AIRL-S-PRM`) is a robust and leading solution for improving LLM reasoning accuracy via reward-guided sampling.