\n
## Histogram: Confidence Level Distribution for Correct and Incorrect Answers
### Overview
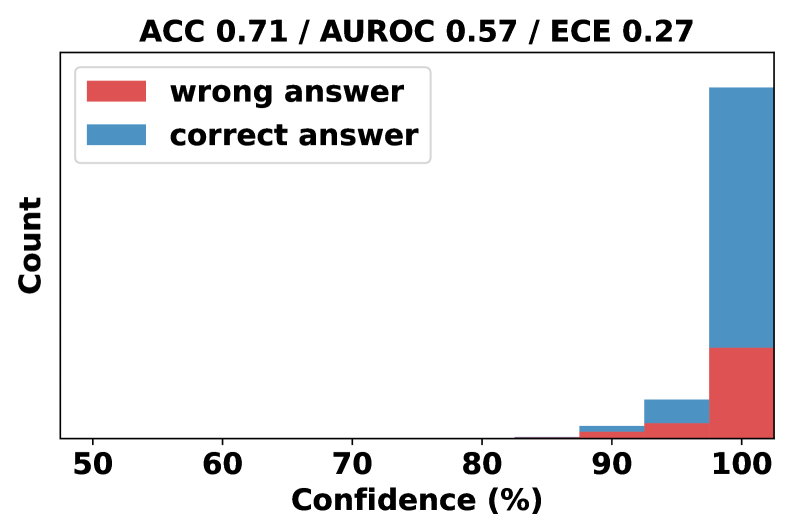
This image presents a histogram displaying the distribution of confidence levels for correct and incorrect answers. The x-axis represents confidence levels in percentage, ranging from 50% to 100%. The y-axis represents the count of answers falling within each confidence level bin. Two data series are presented: one for "wrong answer" (represented in red) and one for "correct answer" (represented in blue). The top of the image displays overall performance metrics: Accuracy (ACC), Area Under the Receiver Operating Characteristic curve (AUROC), and Expected Calibration Error (ECE).
### Components/Axes
* **Title:** "ACC 0.71 / AUROC 0.57 / ECE 0.27"
* **X-axis Label:** "Confidence (%)"
* **Y-axis Label:** "Count"
* **Legend:** Located at the top-left corner.
* "wrong answer" - Red color
* "correct answer" - Blue color
* **X-axis Scale:** Ranges from 50 to 100, with tick marks at 60, 70, 80, 90.
* **Y-axis Scale:** Not explicitly labeled, but represents the count of answers.
### Detailed Analysis
The histogram shows the distribution of confidence levels for both correct and incorrect answers.
* **Correct Answer (Blue):** The blue bars representing correct answers show a strong concentration of high confidence levels, particularly between 95% and 100%. The count of correct answers increases sharply as confidence approaches 100%. There are very few correct answers with confidence levels below 90%.
* Approximate counts (estimated from bar heights):
* 90-95% Confidence: ~5
* 95-100% Confidence: ~30
* **Wrong Answer (Red):** The red bars representing wrong answers show a distribution skewed towards lower confidence levels, but with a significant tail extending into higher confidence levels. There is a noticeable number of wrong answers with confidence levels above 90%, indicating overconfidence in incorrect predictions.
* Approximate counts (estimated from bar heights):
* 50-90% Confidence: ~5
* 90-95% Confidence: ~10
* 95-100% Confidence: ~15
### Key Observations
* The model exhibits a tendency towards overconfidence, as evidenced by the presence of wrong answers with high confidence levels.
* Correct answers are overwhelmingly associated with high confidence levels (above 90%).
* The distribution of confidence levels for wrong answers is more spread out than that for correct answers.
* The AUROC score of 0.57 suggests poor discrimination between correct and incorrect predictions based on confidence.
* The ECE score of 0.27 indicates a moderate level of miscalibration.
### Interpretation
The data suggests that while the model can be confident when it is correct, it frequently exhibits overconfidence when it is wrong. This is reflected in the relatively high ECE score and the low AUROC score. The histogram visually demonstrates this miscalibration, with a significant number of incorrect predictions occurring at high confidence levels. The accuracy of 0.71 indicates that the model is performing better than random chance, but the miscalibration suggests that the confidence scores are not reliable indicators of prediction accuracy. This could be due to biases in the training data or limitations in the model's architecture. Further investigation is needed to understand the root cause of the miscalibration and improve the model's reliability. The model is not well calibrated, meaning its predicted probabilities do not accurately reflect the true likelihood of correctness.