## Confidence Distribution Histogram: Model Calibration Analysis
### Overview
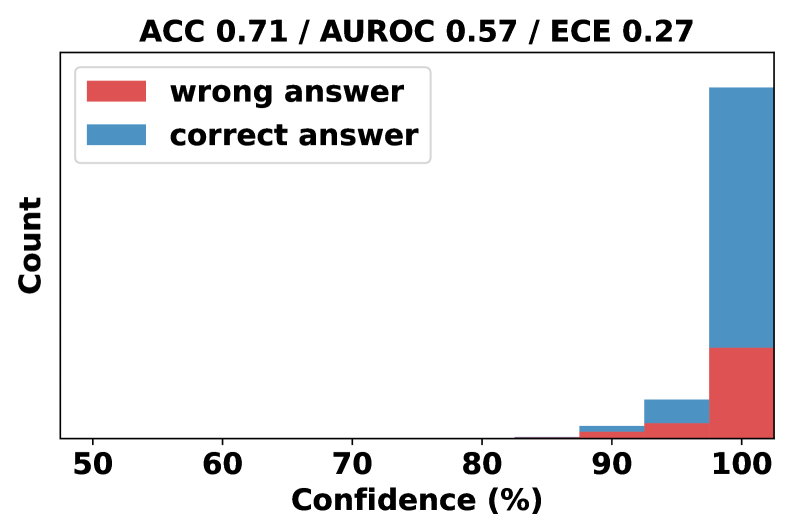
The image displays a stacked bar chart (histogram) analyzing the relationship between a model's confidence scores and the correctness of its answers. The chart is titled with three key performance metrics: Accuracy (ACC), Area Under the Receiver Operating Characteristic curve (AUROC), and Expected Calibration Error (ECE). The visualization aims to show how the model's confidence correlates with its actual performance.
### Components/Axes
* **Title:** "ACC 0.71 / AUROC 0.57 / ECE 0.27" (located at the top center).
* **Y-Axis:** Labeled "Count" (vertical text on the left). The scale is not numerically marked, but the relative heights of the bars indicate frequency.
* **X-Axis:** Labeled "Confidence (%)" (at the bottom). The axis has major tick marks at 50, 60, 70, 80, 90, and 100.
* **Legend:** Positioned in the top-left corner of the plot area.
* A red rectangle corresponds to the label "wrong answer".
* A blue rectangle corresponds to the label "correct answer".
* **Data Series:** The chart contains stacked bars for three visible confidence bins, approximately centered at 90%, 95%, and 100% confidence. Each bar is composed of a red segment (bottom) and a blue segment (top).
### Detailed Analysis
The chart presents data for three primary confidence intervals. The counts are approximate, derived from visual estimation of bar heights.
1. **~90% Confidence Bin:**
* **Total Height (Count):** Very low, approximately 2-3 units.
* **Composition:** The bar is almost entirely blue ("correct answer"). The red ("wrong answer") segment is a very thin sliver at the base, representing a negligible count (≈0-1).
2. **~95% Confidence Bin:**
* **Total Height (Count):** Moderate, approximately 8-10 units.
* **Composition:** The bar is predominantly blue. The red segment at the base is now clearly visible but still constitutes a minority of the total height, representing an estimated count of 2-3.
3. **100% Confidence Bin:**
* **Total Height (Count):** Very high, the tallest bar, approximately 45-50 units.
* **Composition:** This bar shows a significant increase in both components.
* The red segment ("wrong answer") has grown substantially, representing an estimated count of 12-15.
* The blue segment ("correct answer") is the largest component, representing an estimated count of 33-38.
**Trend Verification:** The visual trend for both data series is a sharp upward slope as confidence increases from 90% to 100%. The "correct answer" (blue) series shows a steeper increase in absolute count. The proportion of "wrong answer" (red) within each bar also increases with confidence, indicating that while the model is more often correct at high confidence, the absolute number of high-confidence errors also rises.
### Key Observations
* **Extreme Confidence Dominance:** The vast majority of predictions (both correct and incorrect) are made with very high confidence (95-100%). There are virtually no predictions shown in the 50-85% confidence range.
* **High-Confidence Errors:** A substantial number of incorrect predictions are made with 100% confidence. This is the most notable anomaly.
* **Calibration Indicator:** The presence of a significant red block at 100% confidence visually explains the relatively high ECE (0.27) reported in the title. The model is overconfident on its errors.
* **Performance Metrics:** The title provides summary statistics: Accuracy (ACC) of 71%, an AUROC of 0.57 (indicating modest discriminative ability between correct and incorrect classes), and an ECE of 0.27 (indicating poor calibration, where confidence does not reliably match accuracy).
### Interpretation
This histogram is a diagnostic tool for model calibration. It reveals that the model exhibits a strong bias toward making predictions with extreme confidence (near 100%). While it is correct more often than not at this confidence level, the absolute number of confident errors is high. This pattern suggests the model is **overconfident**.
The data demonstrates a critical disconnect between the model's stated confidence and its actual reliability. For a well-calibrated model, the proportion of errors within a confidence bin should match the error rate implied by that confidence (e.g., at 90% confidence, ~10% of predictions should be wrong). Here, at 100% confidence, a non-trivial fraction (estimated ~25-30%) of predictions are incorrect, which is a severe calibration failure.
The practical implication is that the raw confidence scores from this model cannot be trusted as true probabilities. Users or downstream systems should not treat a "100% confidence" prediction as a guarantee of correctness. This model would benefit from calibration techniques (e.g., temperature scaling, Platt scaling) to align its confidence outputs with its actual accuracy, thereby making its uncertainty estimates more meaningful and reliable for decision-making.