## Bar Chart: Model Performance by Confidence Level
### Overview
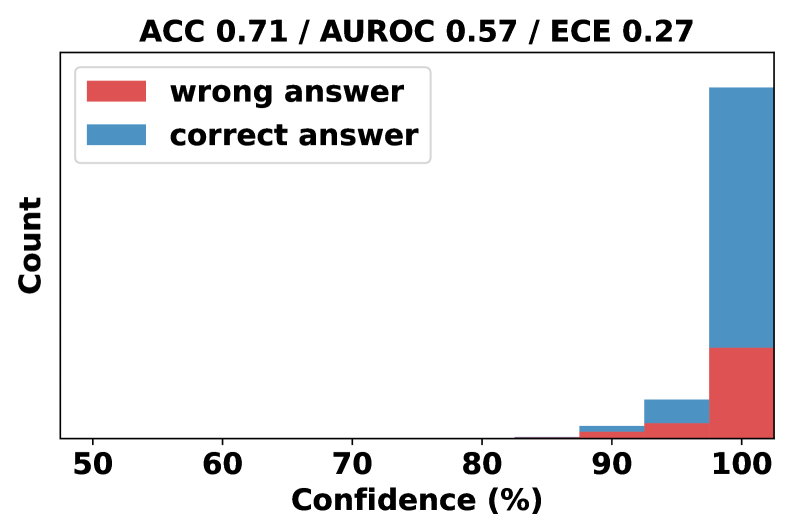
The chart visualizes the distribution of model predictions categorized by confidence levels (50-100%) and correctness (correct/wrong answers). Key metrics (ACC 0.71, AUROC 0.57, ECE 0.27) are displayed in the title. The data is concentrated at 100% confidence, with no bars for lower confidence ranges (50-90%).
### Components/Axes
- **X-axis**: Confidence (%) ranging from 50 to 100 in 10% increments.
- **Y-axis**: Count of predictions (no explicit scale, but relative heights are visible).
- **Legend**:
- Red: Wrong answers
- Blue: Correct answers
- **Title**: "ACC 0.71 / AUROC 0.57 / ECE 0.27" (top-center).
- **Bars**: Only present at 100% confidence; no data for 50-90%.
### Detailed Analysis
- **100% Confidence**:
- **Correct Answers (Blue)**: Tallest bar, occupying ~70% of the y-axis height.
- **Wrong Answers (Red)**: Shorter bar, occupying ~30% of the y-axis height.
- **50-90% Confidence**: No bars present, indicating no predictions in these ranges.
- **Metrics**:
- **ACC (Accuracy)**: 0.71 (71% overall correctness).
- **AUROC (Area Under ROC Curve)**: 0.57 (model barely better than random chance).
- **ECE (Expected Calibration Error)**: 0.27 (moderate calibration error).
### Key Observations
1. **Data Concentration**: All predictions are at 100% confidence, suggesting the model operates in a binary "certain" or "uncertain" regime.
2. **Dominance of Correct Answers**: At 100% confidence, correct answers outnumber wrong answers by ~2.3:1 (70% vs. 30%).
3. **Missing Lower Confidence Data**: No predictions in 50-90% confidence ranges, raising questions about model design or data preprocessing.
4. **Metric Discrepancy**: High ACC (0.71) conflicts with low AUROC (0.57), implying the model may have high accuracy but poor discriminative power for imbalanced classes.
### Interpretation
- **Model Behavior**: The chart suggests the model is highly confident in its predictions, with correctness tightly correlated to 100% confidence. However, the low AUROC indicates the model struggles to distinguish between classes effectively, possibly due to class imbalance or poor feature separation.
- **Calibration Issues**: The ECE of 0.27 reveals a mismatch between predicted confidence and actual accuracy. For example, the model may overestimate confidence in correct predictions while underestimating it for wrong ones.
- **Practical Implications**: The absence of lower-confidence predictions could lead to over-reliance on the model’s outputs, increasing the risk of errors in real-world applications. The high ACC might be misleading if the dataset is imbalanced (e.g., majority class dominance).
### Spatial Grounding
- **Legend**: Top-left corner, clearly associating red with wrong answers and blue with correct answers.
- **Bars**: Positioned at the far right (100% confidence), with blue (correct) dominating the vertical space.
- **Title**: Centered at the top, displaying key metrics for quick reference.
### Content Details
- **Textual Elements**:
- Title: "ACC 0.71 / AUROC 0.57 / ECE 0.27" (black text, top-center).
- Legend: Red = "wrong answer," Blue = "correct answer" (top-left).
- Axis Labels: "Confidence (%)" (x-axis, bottom), "Count" (y-axis, left).
- **Numerical Values**:
- Confidence thresholds: 50, 60, 70, 80, 90, 100 (x-axis).
- Approximate counts: Blue bar ~70 units, Red bar ~30 units (y-axis).
### Notable Anomalies
- **Missing Data**: No predictions in 50-90% confidence ranges, which is unusual for most classification models.
- **Metric Conflict**: High ACC vs. low AUROC suggests potential issues with class distribution or evaluation methodology.