# Sepsis Prediction Model (Training) - Confusion Matrix Analysis
## Key Components
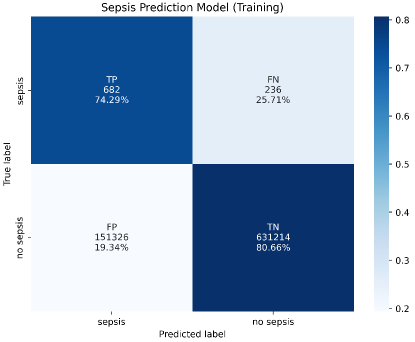
- **Title**: "Sepsis Prediction Model (Training)"
- **Axes**:
- **X-axis (Predicted label)**:
- Categories: "sepsis", "no sepsis"
- **Y-axis (True label)**:
- Categories: "sepsis", "no sepsis"
- **Legend**:
- **Color Scale**: Light blue (0.2) to Dark blue (0.8)
- **Placement**: Right side of the matrix
## Data Points and Categories
| **True Label** | **Predicted Label** | **Value** | **Percentage** | **Color Intensity** |
|----------------|---------------------|-----------|----------------|---------------------|
| sepsis | sepsis | 682 | 74.29% | Dark blue (0.74) |
| sepsis | no sepsis | 236 | 25.71% | Light blue (0.25) |
| no sepsis | sepsis | 151,326 | 19.34% | Very light blue (0.19) |
| no sepsis | no sepsis | 631,214 | 80.66% | Dark blue (0.80) |
## Observations
1. **True Positives (TP)**:
- **Value**: 682 cases
- **Percentage**: 74.29% of actual sepsis cases correctly identified.
- **Color**: Dark blue (matches 0.74 on legend).
2. **False Negatives (FN)**:
- **Value**: 236 cases
- **Percentage**: 25.71% of actual sepsis cases missed.
- **Color**: Light blue (matches 0.25 on legend).
3. **False Positives (FP)**:
- **Value**: 151,326 cases
- **Percentage**: 19.34% of actual "no sepsis" cases incorrectly flagged.
- **Color**: Very light blue (0.19), **note**: This value falls **below the legend's minimum (0.2)**, indicating a potential inconsistency in color mapping.
4. **True Negatives (TN)**:
- **Value**: 631,214 cases
- **Percentage**: 80.66% of actual "no sepsis" cases correctly identified.
- **Color**: Dark blue (matches 0.80 on legend).
## Trends and Implications
- **High Accuracy in TN**: The model performs well in identifying non-sepsis cases (80.66% TN).
- **Moderate TP Performance**: 74.29% TP suggests room for improvement in sepsis detection.
- **Significant FP Rate**: 19.34% FP indicates a high rate of false alarms, which could lead to unnecessary interventions.
- **Critical FN Rate**: 25.71% FN highlights a risk of missing sepsis cases, which could have severe clinical consequences.
## Spatial Grounding
- **Legend Position**: Right-aligned color bar (0.2–0.8).
- **Color Consistency Check**:
- TP (0.74) and TN (0.80) align with dark blue.
- FN (0.25) aligns with light blue.
- FP (0.19) falls **outside the legend's range**, suggesting a possible error in data visualization.
## Conclusion
The model demonstrates strong performance in ruling out sepsis (high TN) but struggles with both detecting sepsis (moderate TP) and avoiding false positives (high FP). The FN rate raises concerns about clinical reliability. Further validation and model refinement are recommended.