## Scatter Plot: CMA Score vs. Facilitation by Head Type
### Overview
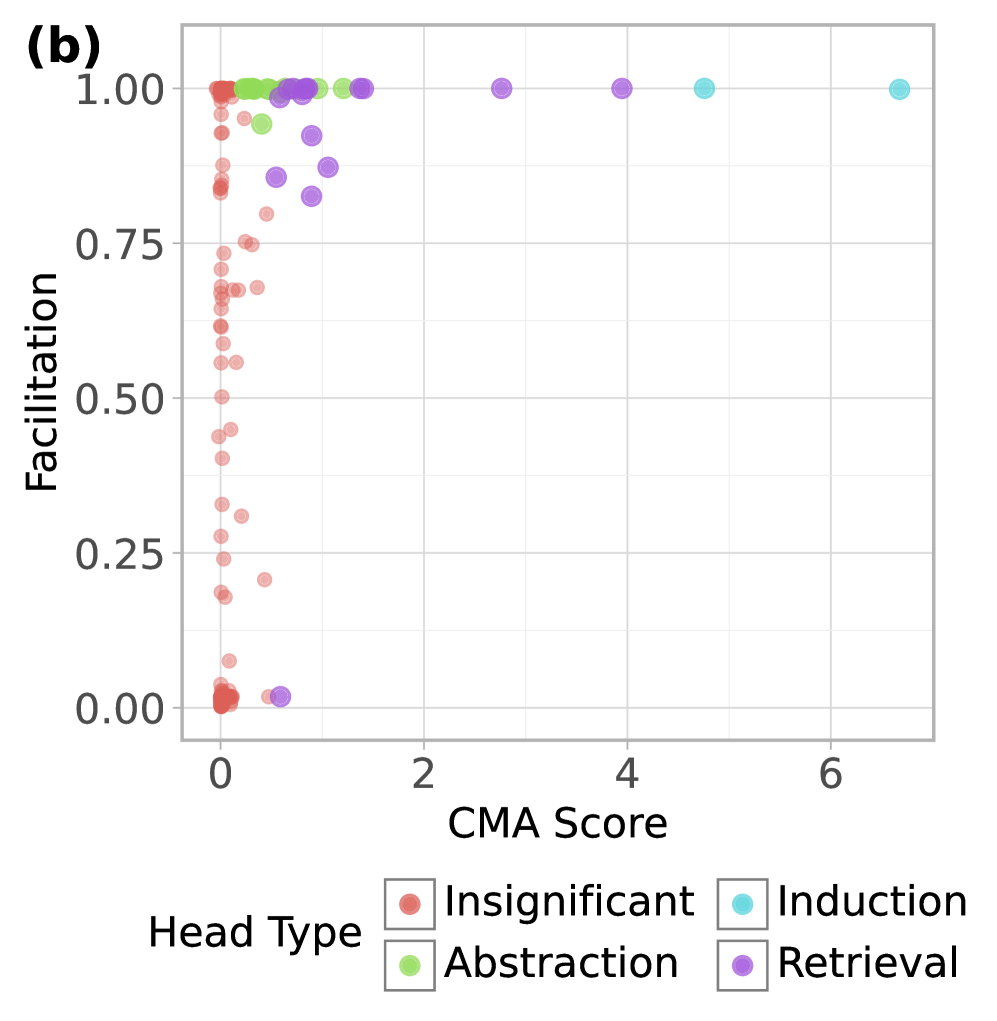
This image is a scatter plot labeled "(b)" in the top-left corner. It visualizes the relationship between two numerical variables, "CMA Score" and "Facilitation," for data points categorized into four distinct "Head Types." The plot reveals how different cognitive or processing head types cluster and distribute across these two dimensions.
### Components/Axes
* **Plot Label:** "(b)" located in the top-left corner, outside the main axes.
* **X-Axis:**
* **Title:** "CMA Score"
* **Scale:** Linear scale ranging from 0 to 6.
* **Major Tick Marks:** 0, 2, 4, 6.
* **Y-Axis:**
* **Title:** "Facilitation"
* **Scale:** Linear scale ranging from 0.00 to 1.00.
* **Major Tick Marks:** 0.00, 0.25, 0.50, 0.75, 1.00.
* **Legend:**
* **Title:** "Head Type"
* **Location:** Centered below the x-axis.
* **Categories & Colors:**
* **Insignificant:** Red/Salmon circle.
* **Abstraction:** Light Green circle.
* **Induction:** Cyan/Light Blue circle.
* **Retrieval:** Purple circle.
### Detailed Analysis
**Data Point Distribution by Head Type:**
1. **Insignificant (Red):**
* **Spatial Grounding:** Heavily clustered along the vertical line where CMA Score ≈ 0.
* **Trend Verification:** Shows no clear linear trend. Points are vertically dispersed.
* **Values:** CMA Score is consistently near 0. Facilitation values are widely scattered, ranging from approximately 0.00 to 1.00, with a dense concentration between 0.25 and 1.00.
2. **Abstraction (Green):**
* **Spatial Grounding:** Clustered in the top-left quadrant of the plot.
* **Trend Verification:** Points are grouped at high Facilitation levels.
* **Values:** CMA Score is low, approximately between 0 and 1.5. Facilitation is consistently high, mostly between 0.90 and 1.00.
3. **Retrieval (Purple):**
* **Spatial Grounding:** Scattered across the upper half of the plot, from left to center.
* **Trend Verification:** Shows a slight positive trend; as CMA Score increases, Facilitation tends to remain high but with more variability.
* **Values:** CMA Score ranges from approximately 0 to 4. Facilitation is generally high (mostly > 0.75), but with notable points dipping to around 0.80 and one outlier near 0.00 at a low CMA Score.
4. **Induction (Cyan):**
* **Spatial Grounding:** Located in the top-right quadrant, isolated from other clusters.
* **Trend Verification:** Points are grouped at the highest CMA Scores and high Facilitation.
* **Values:** CMA Score is high, approximately between 4 and 7. Facilitation is consistently high, at or near 1.00.
### Key Observations
* **Distinct Clustering:** The four head types form largely non-overlapping clusters, suggesting they represent fundamentally different categories in this CMA-Facilitation space.
* **CMA Score Gradient:** There is a clear progression in typical CMA Score from left to right: Insignificant (≈0) < Abstraction (0-1.5) < Retrieval (0-4) < Induction (4-7).
* **Facilitation Ceiling:** For Abstraction, Retrieval, and Induction, Facilitation values are predominantly high (>0.75). The "Insignificant" type is the only one showing a full range of Facilitation values.
* **Outlier:** A single purple (Retrieval) data point is located at approximately (CMA Score: 0.5, Facilitation: 0.00), which is an outlier compared to the high-Facilitation trend of its group.
### Interpretation
The data suggests a strong relationship between the categorical "Head Type" and the two measured variables. The "CMA Score" appears to be a key differentiator between the types, potentially representing a measure of complexity, cognitive load, or processing depth.
* **Insignificant** heads operate at a baseline CMA Score (≈0) and their effectiveness (Facilitation) is highly variable, implying their contribution is not consistently tied to this complexity measure.
* **Abstraction** and **Retrieval** heads function at low-to-moderate complexity but achieve high facilitation, indicating they are efficient processes for tasks within their CMA range.
* **Induction** heads are uniquely associated with high CMA Scores and high Facilitation. This could imply that inductive reasoning processes are both required for and effective at handling the most complex tasks measured by the CMA Score.
The plot effectively argues that these head types are not just labels but correspond to distinct operational profiles. The clear separation, especially of the Induction cluster, highlights it as a specialized, high-complexity, high-impact process. The outlier in the Retrieval group warrants investigation as it may represent a failure case or a different sub-type.