## Scatter Plot: Head Type vs. CMA Score and Facilitation
### Overview
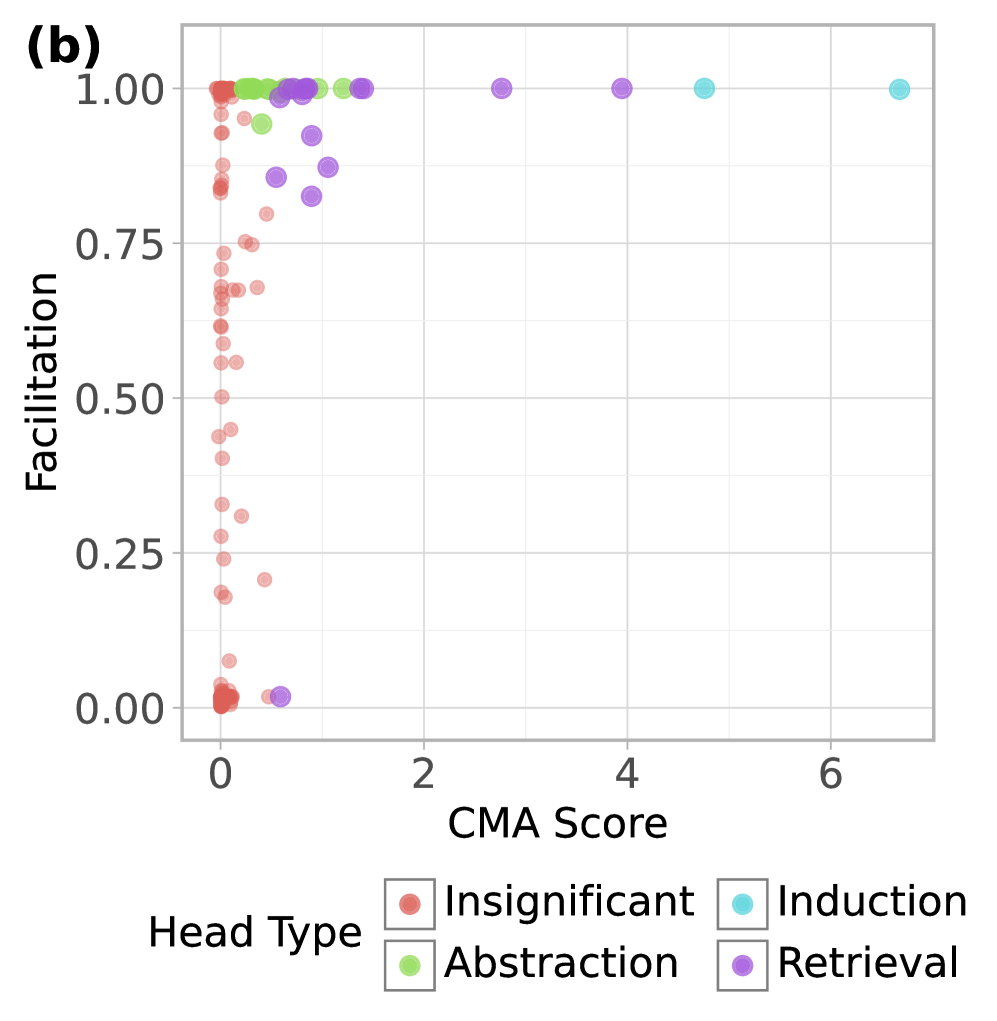
The image is a scatter plot visualizing the relationship between **CMA Score** (x-axis) and **Facilitation** (y-axis) across four head types: **Insignificant**, **Abstraction**, **Retrieval**, and **Induction**. Data points are color-coded, with distinct clusters for each head type. The plot includes a legend at the bottom left, axis labels, and gridlines for reference.
---
### Components/Axes
- **X-axis (CMA Score)**: Ranges from 0 to 6.5, with gridlines at intervals of 1.0.
- **Y-axis (Facilitation)**: Ranges from 0.0 to 1.0, with gridlines at intervals of 0.25.
- **Legend**: Located at the bottom left, mapping colors to head types:
- **Red**: Insignificant
- **Green**: Abstraction
- **Purple**: Retrieval
- **Cyan**: Induction
- **Gridlines**: Horizontal and vertical lines for alignment.
---
### Detailed Analysis
#### Data Series Trends
1. **Insignificant (Red)**:
- **Distribution**: Scattered across the lower-left quadrant (CMA: 0–1.5, Facilitation: 0.0–0.75).
- **Trend**: Most points cluster near the origin, with a few outliers at higher Facilitation (e.g., ~0.75 at CMA ~0.5).
- **Uncertainty**: Some points near CMA ~1.0 show variability in Facilitation (0.25–0.5).
2. **Abstraction (Green)**:
- **Distribution**: Clustered near the top-left (CMA: 0.5–1.5, Facilitation: 0.8–1.0).
- **Trend**: Tight grouping suggests a consistent high Facilitation score for moderate CMA values.
- **Uncertainty**: Minimal spread; all points within a narrow band.
3. **Retrieval (Purple)**:
- **Distribution**: Spread across the upper-middle range (CMA: 1.5–3.5, Facilitation: 0.7–1.0).
- **Trend**: Points show a slight upward trend in Facilitation as CMA increases, but with variability.
- **Uncertainty**: Some points at CMA ~2.0 have Facilitation ~0.8–0.9, while others at CMA ~3.0 reach ~1.0.
4. **Induction (Cyan)**:
- **Distribution**: Concentrated at the far right (CMA: 4.5–6.5, Facilitation: 0.9–1.0).
- **Trend**: All points align horizontally at the top of the plot, indicating maximum Facilitation for high CMA scores.
- **Uncertainty**: No variability in Facilitation; all points at ~1.0.
---
### Key Observations
- **Induction (Cyan)**: Dominates the high-CMA, high-Facilitation region, suggesting a strong positive correlation.
- **Insignificant (Red)**: Lowest CMA and Facilitation scores, with minimal overlap with other groups.
- **Abstraction (Green)**: High Facilitation but limited to moderate CMA scores, indicating a plateau effect.
- **Retrieval (Purple)**: Intermediate CMA scores with variable Facilitation, showing less consistency than Induction or Abstraction.
---
### Interpretation
The plot reveals distinct performance patterns across head types:
1. **Induction** demonstrates the strongest relationship between CMA Score and Facilitation, achieving maximum Facilitation (1.0) at high CMA values (4.5–6.5). This suggests Induction head types are highly effective in high-CMA contexts.
2. **Abstraction** maintains high Facilitation (0.8–1.0) even at moderate CMA scores (0.5–1.5), implying efficiency in lower-CMA scenarios.
3. **Retrieval** shows a weaker but positive trend, with Facilitation increasing as CMA rises, though variability persists.
4. **Insignificant** head types underperform across all CMA ranges, with Facilitation scores rarely exceeding 0.75.
The data highlights that **Induction** and **Abstraction** head types are most effective in their respective CMA ranges, while **Insignificant** head types consistently lag. The absence of data points in the lower-right quadrant (high CMA, low Facilitation) suggests no head type performs poorly at high CMA scores. This could indicate that CMA Score is a critical factor in determining Facilitation, with head type acting as a modifier.