## Line Chart: Accuracy vs. Attack Ratio
### Overview
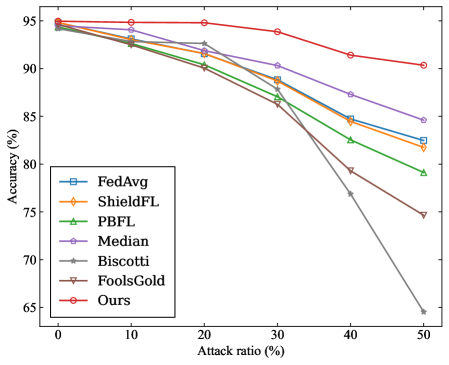
The image is a line chart comparing the accuracy of eight different methods (FedAvg, ShieldFL, PBFL, Median, Biscotti, FoolsGold, Ours) across varying attack ratios (0% to 50%). Accuracy (%) is plotted on the y-axis (65–95%), and attack ratio (%) is on the x-axis (0–50%). Each method is represented by a distinct colored line with a unique marker.
### Components/Axes
- **Y-axis**: Accuracy (%) (65–95%), labeled "Accuracy (%)".
- **X-axis**: Attack ratio (%) (0–50%), labeled "Attack ratio (%)".
- **Legend**: Located in the bottom-left corner, mapping colors/markers to methods:
- Blue square: FedAvg
- Orange diamond: ShieldFL
- Green triangle: PBFL
- Purple diamond: Median
- Gray star: Biscotti
- Brown triangle: FoolsGold
- Red circle: Ours
### Detailed Analysis
1. **Ours (Red Circle)**:
- Starts at ~95% accuracy at 0% attack ratio.
- Declines gradually to ~90% at 50% attack ratio.
- Maintains the highest accuracy across all attack ratios.
2. **FedAvg (Blue Square)**:
- Begins at ~94% accuracy at 0% attack ratio.
- Drops to ~82% at 50% attack ratio.
- Shows a steady decline.
3. **ShieldFL (Orange Diamond)**:
- Starts at ~94% accuracy at 0% attack ratio.
- Declines to ~81% at 50% attack ratio.
- Slightly steeper decline than FedAvg.
4. **PBFL (Green Triangle)**:
- Begins at ~94% accuracy at 0% attack ratio.
- Drops to ~79% at 50% attack ratio.
- Steady decline with moderate slope.
5. **Median (Purple Diamond)**:
- Starts at ~94% accuracy at 0% attack ratio.
- Declines to ~85% at 50% attack ratio.
- Gradual slope, similar to FedAvg.
6. **Biscotti (Gray Star)**:
- Begins at ~94% accuracy at 0% attack ratio.
- Plummets to ~65% at 50% attack ratio.
- Sharpest decline among all methods.
7. **FoolsGold (Brown Triangle)**:
- Starts at ~94% accuracy at 0% attack ratio.
- Drops to ~75% at 50% attack ratio.
- Moderate decline, steeper than FedAvg/ShieldFL.
### Key Observations
- **Ours** consistently outperforms all other methods, maintaining the highest accuracy even at 50% attack ratio.
- **Biscotti** exhibits the most severe degradation, losing ~30% accuracy at maximum attack ratio.
- Methods like FedAvg, ShieldFL, and PBFL show similar initial performance but diverge significantly under higher attack ratios.
- The red line ("Ours") remains the flattest, indicating robustness against attacks.
### Interpretation
The data demonstrates that the method labeled "Ours" is the most resilient to adversarial attacks, retaining ~90% accuracy even at 50% attack ratio. In contrast, Biscotti’s performance collapses under pressure, suggesting it is highly vulnerable. The gradual declines in other methods highlight trade-offs between accuracy and attack resistance. This chart underscores the importance of robust defense mechanisms in federated learning systems, with "Ours" setting a benchmark for performance under adversarial conditions.