## Diagram: Hexagonal Lattice Network with Binary Node States
### Overview
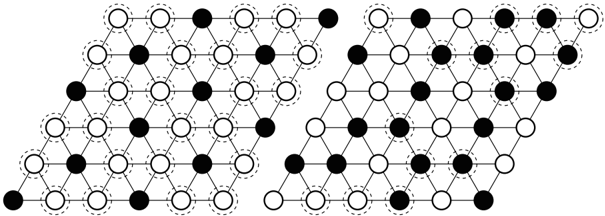
The image displays two distinct hexagonal lattice structures, presented side-by-side. Each lattice is composed of nodes (circles) connected by edges (lines), forming a honeycomb pattern. The nodes exist in one of two states: solid black or white with a black outline. Some white nodes are further distinguished by a dashed circular outline. The diagram appears to illustrate two different configurations or states of a network, possibly representing a physical system (like atoms in a crystal), a computational model, or a graph theory concept. There is no textual information, labels, axes, or legends present in the image.
### Components/Axes
* **Primary Structure:** Two separate hexagonal (honeycomb) lattices.
* **Nodes:** Circles representing vertices in the lattice.
* **State 1:** Solid black circles.
* **State 2:** White circles with a solid black outline.
* **Sub-State:** A subset of the white nodes features an additional dashed circular outline concentric with the solid outline.
* **Edges:** Straight lines connecting adjacent nodes, forming the hexagonal grid.
* **Layout:** The two lattices are positioned horizontally, with the left lattice slightly offset vertically relative to the right one. Each lattice is a parallelogram-shaped section of an infinite hexagonal grid.
### Detailed Analysis
**Left Lattice:**
* **Structure:** A 5-row (by the slanted vertical axis) section of a hexagonal grid.
* **Node Distribution:** Contains a mixture of black and white nodes. The distribution does not follow an immediately obvious simple repeating pattern across the entire section.
* **Dashed Nodes:** Several white nodes have dashed outlines. Their placement appears scattered. For example, in the top row, the 2nd and 4th nodes from the left are dashed. In the bottom row, the 2nd node from the left is dashed.
**Right Lattice:**
* **Structure:** Also a 5-row section of a hexagonal grid, similar in overall shape to the left lattice.
* **Node Distribution:** Also contains a mixture of black and white nodes. The specific arrangement of black and white nodes differs from the left lattice.
* **Dashed Nodes:** Similarly, several white nodes have dashed outlines. Their positions are different from those in the left lattice. For instance, in the top row, the 1st and 5th nodes from the left are dashed.
**Spatial Grounding & Pattern Verification:**
* **Trend/Pattern Check:** There is no numerical data or continuous trend to verify. The "data" is the categorical state (black/white/dashed) of each discrete node at a fixed position.
* **Component Isolation:** The image can be segmented into two independent regions: the Left Lattice and the Right Lattice. Each must be analyzed separately to avoid mixing their distinct configurations.
* **Cross-Reference:** Without a legend, the meaning of the node states (black, white, dashed-white) is undefined. The analysis can only describe their visual presence and relative positions.
### Key Observations
1. **Binary State with a Marker:** The system has a primary binary state (black vs. white), with a secondary marker (dashed outline) applied to a subset of the white nodes.
2. **Distinct Configurations:** The left and right lattices show two different specific arrangements of these node states. They are not simple translations or rotations of each other.
3. **No Obvious Long-Range Order:** In both lattices, the black nodes do not form a perfectly alternating (checkerboard) pattern nor large uniform clusters. The pattern appears somewhat disordered or complex.
4. **Absence of Text:** The diagram is purely graphical. All information is encoded in the visual properties of the nodes and their connections.
### Interpretation
This diagram is a structural illustration, not a data chart. It does not provide quantitative facts or trends but rather presents two qualitative states of a networked system.
* **What it Demonstrates:** The image likely serves to compare two different configurations of a system modeled on a hexagonal lattice. This could represent:
* **Physics/Chemistry:** Two possible arrangements of atoms (e.g., different spin states in a magnetic material, or different types of atoms in an alloy) on a crystal lattice. The dashed circles might indicate defects, impurities, or atoms in an excited state.
* **Computer Science/Graph Theory:** Two different colorings or states of nodes in a graph, potentially illustrating concepts like graph coloring, network percolation, or cellular automata states.
* **Network Science:** Two snapshots of a network where nodes can be active (black) or inactive (white), with dashed nodes representing a special status (e.g., recently changed state, or under observation).
* **Relationship Between Elements:** The connections (edges) define the neighborhood and interaction pathways between nodes. The state of any given node (black/white/dashed) is likely influenced by or related to the states of its immediate neighbors in the lattice.
* **Notable Anomalies:** The key "anomaly" or point of interest is the specific, non-random-looking yet complex pattern of black nodes and dashed nodes in each lattice. The purpose of the diagram is almost certainly to draw attention to these specific patterns and invite comparison between the two. The lack of a key means the viewer must infer the meaning from the context in which the diagram appears (e.g., a scientific paper caption).