## Diagram: Hexagonal Grid Pattern Comparison
### Overview
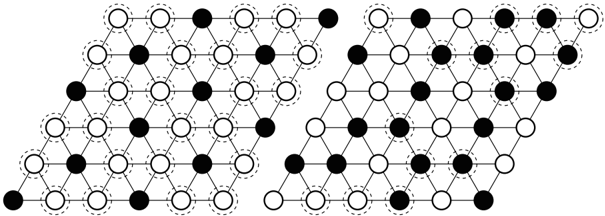
The image depicts two adjacent hexagonal grids, each composed of interconnected nodes (circles) with alternating black and white colors. The grids are structured with dashed lines connecting nodes, suggesting relationships or pathways. The left grid exhibits a diagonal pattern of black nodes, while the right grid shows a more randomized distribution of black nodes.
### Components/Axes
- **Grid Structure**:
- Both grids are hexagonal, with nodes arranged in a tessellated pattern.
- Nodes are represented as circles, with black and white colors.
- Dashed lines connect nodes, possibly indicating edges or interactions.
- **Color Coding**:
- Black nodes are distributed in a diagonal pattern (left grid) and randomly (right grid).
- White nodes fill the remaining positions in both grids.
- **No Labels or Legends**:
- No textual labels, axis titles, or legends are present in the image.
### Detailed Analysis
- **Left Grid (Diagonal Pattern)**:
- Black nodes form a diagonal line from the bottom-left to the top-right of the grid.
- White nodes are evenly distributed around the black nodes.
- Dashed lines connect black nodes to adjacent white nodes, forming a structured network.
- **Right Grid (Random Pattern)**:
- Black nodes are scattered without a clear pattern.
- White nodes fill the remaining positions, maintaining the hexagonal structure.
- Dashed lines connect nodes in a less organized manner compared to the left grid.
### Key Observations
- The left grid’s diagonal black node pattern suggests a systematic or intentional design, while the right grid’s randomness implies variability or lack of structure.
- Dashed lines in both grids may represent connections, but their purpose (e.g., data flow, relationships) is unspecified due to the absence of labels.
- No numerical values, categories, or explicit data points are present.
### Interpretation
The diagram likely illustrates a comparison between two configurations of a network or system:
1. **Structured vs. Randomized Systems**: The left grid could represent a controlled, predictable system (e.g., a lattice or algorithm), while the right grid might symbolize a chaotic or adaptive system.
2. **Node Relationships**: Dashed lines may indicate interactions, dependencies, or pathways, but their exact meaning remains unclear without additional context.
3. **Potential Applications**: This could relate to fields like network theory, material science (e.g., crystal structures), or data visualization, where patterns and connectivity are critical.
**Note**: The image contains no textual information, numerical data, or explicit labels. All interpretations are based on visual patterns and structural analysis.