## Bar Charts: DCCA Coefficient and Station Distribution by Latitude
### Overview
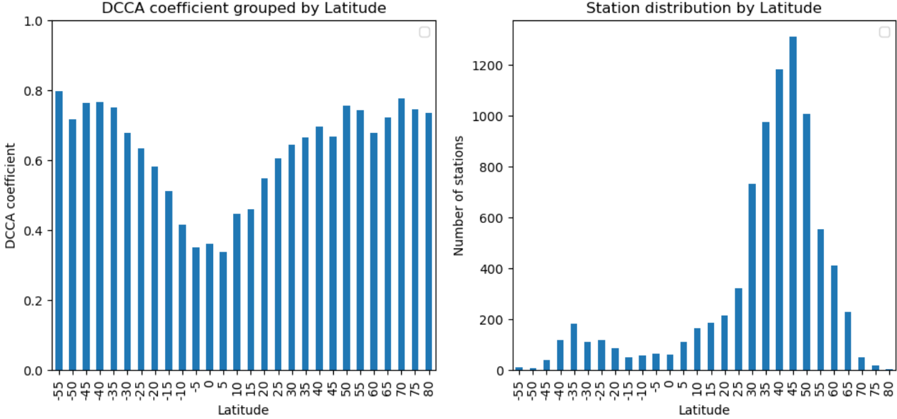
The image contains two bar charts side-by-side. The left chart displays the DCCA (Detrended Cross-Correlation Analysis) coefficient grouped by latitude, while the right chart shows the station distribution by latitude. Both charts use latitude on the x-axis, ranging from approximately -55 to 80 degrees. The y-axis on the left represents the DCCA coefficient, ranging from 0.0 to 1.0. The y-axis on the right represents the number of stations, ranging from 0 to 1200.
### Components/Axes
**Left Chart: DCCA coefficient grouped by Latitude**
* **Title:** DCCA coefficient grouped by Latitude
* **X-axis:** Latitude, ranging from -55 to 80 in increments of 5.
* **Y-axis:** DCCA coefficient, ranging from 0.0 to 1.0 in increments of 0.2.
* **Data:** Blue bars representing the DCCA coefficient for each latitude.
**Right Chart: Station distribution by Latitude**
* **Title:** Station distribution by Latitude
* **X-axis:** Latitude, ranging from -55 to 80 in increments of 5.
* **Y-axis:** Number of stations, ranging from 0 to 1200 in increments of 200.
* **Data:** Blue bars representing the number of stations at each latitude.
### Detailed Analysis
**Left Chart: DCCA coefficient grouped by Latitude**
* **Trend:** The DCCA coefficient is relatively high at negative latitudes (Southern Hemisphere), decreases towards the equator, and then increases again at positive latitudes (Northern Hemisphere).
* **Specific Values:**
* Latitude -55: DCCA coefficient ~ 0.8
* Latitude -30: DCCA coefficient ~ 0.75
* Latitude -5: DCCA coefficient ~ 0.35
* Latitude 45: DCCA coefficient ~ 0.7
* Latitude 75: DCCA coefficient ~ 0.75
**Right Chart: Station distribution by Latitude**
* **Trend:** The number of stations is low at negative latitudes, increases towards the equator, peaks around 45-55 degrees latitude, and then decreases again at higher latitudes.
* **Specific Values:**
* Latitude -40: Number of stations ~ 180
* Latitude 0: Number of stations ~ 60
* Latitude 45: Number of stations ~ 1300
* Latitude 75: Number of stations ~ 100
### Key Observations
* The DCCA coefficient appears to be inversely related to the number of stations. Where the number of stations is high, the DCCA coefficient tends to be lower, and vice versa.
* The station distribution is heavily skewed towards the Northern Hemisphere, with a peak around 45-55 degrees latitude.
* The DCCA coefficient is generally higher in the Southern Hemisphere compared to the equatorial region.
### Interpretation
The charts suggest a relationship between latitude, the DCCA coefficient, and the distribution of stations. The DCCA coefficient, which measures the correlation between two detrended time series, may be influenced by factors that vary with latitude, such as climate, vegetation, or human activity. The uneven distribution of stations, with a concentration in the Northern Hemisphere, could also affect the DCCA coefficient, as more data points may lead to more robust correlation estimates. The inverse relationship between the number of stations and the DCCA coefficient could indicate that regions with more stations have more complex or variable relationships between the time series being analyzed, leading to lower correlation coefficients after detrending. Further investigation would be needed to determine the specific factors driving these patterns and the underlying mechanisms linking latitude, station distribution, and the DCCA coefficient.