## Bar Charts: DCCA Coefficient and Station Distribution by Latitude
### Overview
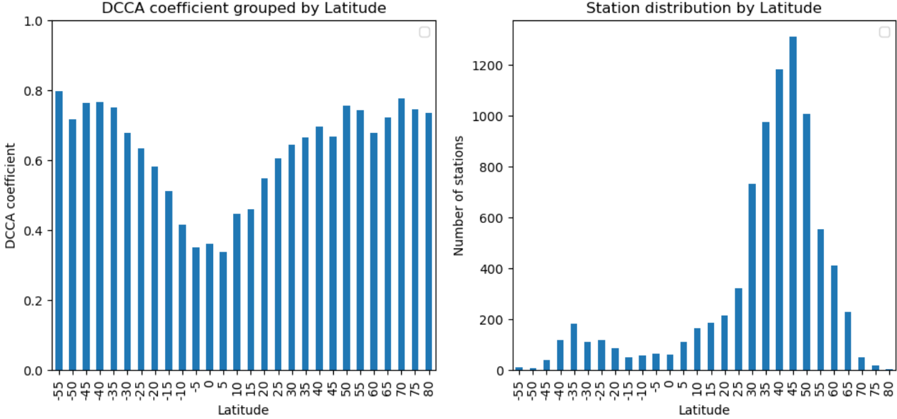
The image displays two vertical bar charts side-by-side, both sharing the same x-axis representing geographic latitude. The left chart visualizes the "DCCA coefficient" across latitude bands, while the right chart shows the "Number of stations" across the same bands. The overall purpose is to compare the distribution of a statistical coefficient (DCCA) with the density of measurement stations across the globe.
### Components/Axes
**Common X-Axis (Both Charts):**
* **Label:** `Latitude`
* **Range:** -55 to 80
* **Increments:** Labeled every 5 degrees (-55, -50, -45, ..., 75, 80). The bars are centered on these 5-degree bins.
**Left Chart: "DCCA coefficient grouped by Latitude"**
* **Title:** `DCCA coefficient grouped by Latitude`
* **Y-Axis Label:** `DCCA coefficient`
* **Y-Axis Scale:** 0.0 to 1.0, with major ticks at 0.0, 0.2, 0.4, 0.6, 0.8, 1.0.
* **Data Series:** A single series of blue bars representing the DCCA coefficient value for each latitude bin.
* **Legend:** None visible. A single data series is implied.
**Right Chart: "Station distribution by Latitude"**
* **Title:** `Station distribution by Latitude`
* **Y-Axis Label:** `Number of stations`
* **Y-Axis Scale:** 0 to 1200, with major ticks at 0, 200, 400, 600, 800, 1000, 1200.
* **Data Series:** A single series of blue bars representing the count of stations for each latitude bin.
* **Legend:** None visible. A single data series is implied.
### Detailed Analysis
**Left Chart: DCCA Coefficient Trends**
* **Trend Verification:** The data series forms a distinct "U" or "V" shape. Coefficients are high at the southern extreme (-55°), decrease to a minimum around the equator (0° to 5°N), and then increase again towards the northern extreme (80°).
* **Approximate Values (by Latitude Bin):**
* **Southern Highs:** -55° (~0.80), -50° (~0.72), -45° (~0.77), -40° (~0.76), -35° (~0.75).
* **Declining Trend:** Values steadily decrease from -30° (~0.68) to the minimum.
* **Equatorial Minimum:** The lowest values occur between 0° (~0.35) and 5°N (~0.33).
* **Northern Rise:** Coefficients begin rising at 10°N (~0.45) and continue a generally upward trend.
* **Northern Highs:** Values plateau at a high level from about 45°N (~0.76) to 80°N (~0.74), with minor fluctuations.
**Right Chart: Station Distribution Trends**
* **Trend Verification:** The data series is strongly right-skewed, forming a sharp peak. Station counts are very low in the Southern Hemisphere, rise gradually in the tropics, and then spike dramatically in the mid-to-high Northern latitudes before falling off sharply at the highest latitudes.
* **Approximate Values (by Latitude Bin):**
* **Southern Hemisphere (Low Density):** Counts are below 200 stations per bin from -55° to -10°. The highest in this region is ~180 at -35°.
* **Tropical Rise:** Counts begin a steady increase from 0° (~60) through 20°N (~220).
* **Northern Peak:** A very sharp increase occurs from 25°N (~320) to a peak at 45°N (~1300). The bins from 35°N to 50°N all contain over 900 stations.
* **Northern Decline:** After 50°N (~1000), counts drop rapidly: 55°N (~550), 60°N (~410), 65°N (~220), 70°N (~50), 75°N (~20), 80°N (~10).
### Key Observations
1. **Inverse Relationship at Extremes:** The highest DCCA coefficients (left chart) occur at latitudes where station density (right chart) is very low (e.g., -55°, 80°N).
2. **Equatorial Anomaly:** The lowest DCCA coefficients coincide with a region of relatively low station density (0°-10°N).
3. **Northern Mid-Latitude Dominance:** The vast majority of stations are concentrated between 30°N and 55°N, which corresponds to a region of moderately high and stable DCCA coefficients (~0.65-0.76).
4. **Data Sparsity:** The Southern Hemisphere, especially south of -30°, and the high Arctic (north of 70°N) are severely under-sampled in terms of station count.
### Interpretation
This paired visualization suggests a potential methodological or environmental factor influencing the DCCA coefficient. The coefficient appears to be **inversely related to data density** at the global extremes but shows a more complex relationship in the well-sampled mid-latitudes.
* **High Coefficients in Sparse Regions:** The high DCCA values in data-sparse polar regions could indicate that the few available stations in these areas report highly coherent or synchronized data, possibly due to large-scale, uniform climate drivers (e.g., polar vortex, Antarctic oscillation) dominating local variability.
* **Low Coefficients at the Equator:** The dip near the equator, despite moderate station density, might reflect the complex, localized nature of tropical climate systems (e.g., convective storms, ITCZ dynamics) which could reduce large-scale coherence between stations.
* **Stability in Data-Rich Regions:** The stable, high coefficients in the densely instrumented Northern mid-latitudes suggest that with sufficient data coverage, the DCCA metric reliably captures strong, large-scale climate patterns (e.g., North Atlantic Oscillation, storm tracks).
**Conclusion:** The charts caution against interpreting the DCCA coefficient without considering underlying data distribution. The metric's value is not uniform globally and may be as much a function of station network geometry and the dominant scale of climate variability in a region as it is of any intrinsic "coherence" property. The most robust analysis likely comes from the well-sampled Northern Hemisphere mid-latitudes.