## Line Chart: Accuracy vs. Number of Reasoning Hops
### Overview
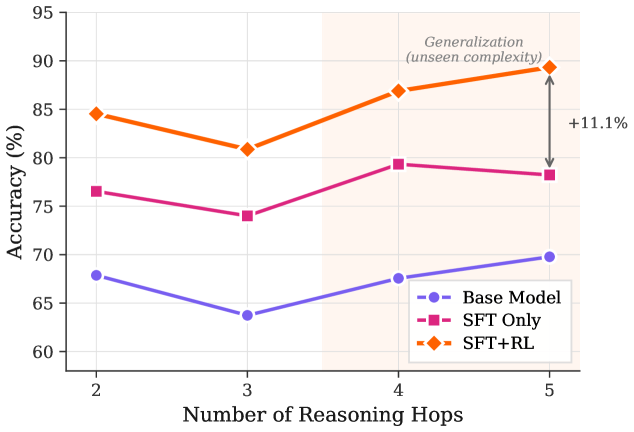
The image is a line chart comparing the accuracy of three different models (Base Model, SFT Only, and SFT+RL) as the number of reasoning hops increases from 2 to 5. The chart highlights the generalization performance of the models on unseen complexity, with a specific focus on the improvement of the SFT+RL model.
### Components/Axes
* **X-axis:** Number of Reasoning Hops (values: 2, 3, 4, 5)
* **Y-axis:** Accuracy (%) (scale: 60 to 95, with increments of 5)
* **Legend (bottom-right):**
* Blue line with circle markers: Base Model
* Magenta line with square markers: SFT Only
* Orange line with diamond markers: SFT+RL
* **Annotation:** "Generalization (unseen complexity)" is written above the data points at x=5, with an arrow indicating a +11.1% increase in accuracy for the SFT+RL model.
* A shaded region spans the area where the number of reasoning hops is greater than 3.
### Detailed Analysis
* **Base Model (Blue):** The accuracy starts at approximately 68% at 2 hops, decreases to approximately 64% at 3 hops, increases to approximately 68% at 4 hops, and reaches approximately 70% at 5 hops.
* **SFT Only (Magenta):** The accuracy starts at approximately 77% at 2 hops, decreases to approximately 74% at 3 hops, increases to approximately 79% at 4 hops, and decreases slightly to approximately 78% at 5 hops.
* **SFT+RL (Orange):** The accuracy starts at approximately 85% at 2 hops, decreases to approximately 81% at 3 hops, increases to approximately 87% at 4 hops, and increases significantly to approximately 89% at 5 hops.
### Key Observations
* The SFT+RL model consistently outperforms the other two models across all numbers of reasoning hops.
* The SFT+RL model shows the most significant improvement in accuracy when the number of reasoning hops increases from 4 to 5, as indicated by the "+11.1%" annotation.
* The Base Model has the lowest accuracy across all reasoning hops.
* All models experience a slight dip in accuracy when the number of reasoning hops increases from 2 to 3.
### Interpretation
The data suggests that the SFT+RL model is better at generalizing to unseen complexity compared to the Base Model and SFT Only model. The significant increase in accuracy for the SFT+RL model when the number of reasoning hops is 5 indicates that it is particularly effective at handling more complex reasoning tasks. The shaded region and the "Generalization (unseen complexity)" annotation emphasize that the models' performance at 5 reasoning hops is indicative of their ability to handle unseen, more complex scenarios. The +11.1% improvement highlights the value of reinforcement learning (RL) in improving the model's generalization capabilities. The dip in accuracy from 2 to 3 hops for all models could indicate a threshold of complexity where initial reasoning steps are less effective, but this is overcome as the number of hops increases further, especially for the SFT+RL model.