## Line Chart: Model Accuracy vs. Reasoning Hops
### Overview
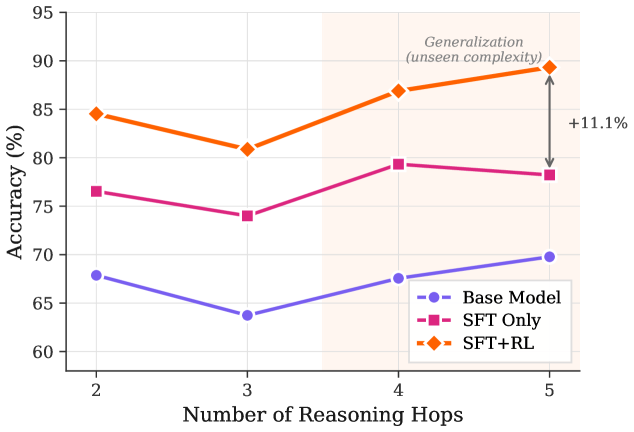
The chart compares the accuracy of three models (Base Model, SFT Only, SFT+RL) across 2 to 5 reasoning hops. A shaded region labeled "Generalization (unseen complexity)" spans hops 3–4, with an arrow highlighting an 11.1% accuracy increase for SFT+RL between hops 4 and 5.
### Components/Axes
- **X-axis**: "Number of Reasoning Hops" (2, 3, 4, 5).
- **Y-axis**: "Accuracy (%)" (60–95, 5% increments).
- **Legend**:
- Blue circle: Base Model
- Pink square: SFT Only
- Orange diamond: SFT+RL
- **Shaded Region**: Horizontal band between hops 3–4 (light orange).
- **Arrow**: Vertical arrow from hop 4 to 5 on the SFT+RL line, labeled "+11.1%".
### Detailed Analysis
- **Base Model (Blue)**:
- Hop 2: ~68%
- Hop 3: ~64%
- Hop 4: ~67%
- Hop 5: ~70%
- *Trend*: Slightly declining then recovering.
- **SFT Only (Pink)**:
- Hop 2: ~77%
- Hop 3: ~74%
- Hop 4: ~79%
- Hop 5: ~78%
- *Trend*: Initial drop, then slight recovery.
- **SFT+RL (Orange)**:
- Hop 2: ~85%
- Hop 3: ~81%
- Hop 4: ~87%
- Hop 5: ~89%
- *Trend*: Initial drop, then sharp recovery and peak.
- **Shaded Region**: Highlights hops 3–4, possibly indicating a focus on generalization.
- **Arrow**: Emphasizes a 11.1% accuracy gain for SFT+RL between hops 4 and 5.
### Key Observations
1. **SFT+RL dominates** in accuracy across all hops, especially after hop 4.
2. **Generalization focus**: The shaded region (hops 3–4) and arrow suggest SFT+RL excels in unseen complexity.
3. **Base Model underperforms** consistently, with minimal improvement.
4. **SFT Only** shows moderate performance but lags behind SFT+RL.
### Interpretation
The data demonstrates that **SFT+RL** significantly outperforms other models, particularly in higher-complexity scenarios (hops 4–5). The 11.1% accuracy jump in SFT+RL between hops 4 and 5, highlighted by the arrow, suggests that reinforcement learning (RL) enhances generalization to unseen tasks. The shaded region (hops 3–4) may represent a critical zone for evaluating model robustness. While SFT Only improves slightly with more hops, its performance plateaus, indicating limitations in handling complexity. The Base Model’s decline at hop 3 and subsequent recovery hints at instability in reasoning processes. Overall, the chart underscores the value of combining SFT with RL for complex, real-world applications.