## Chart Type: Line Graphs Comparing Model Performance
### Overview
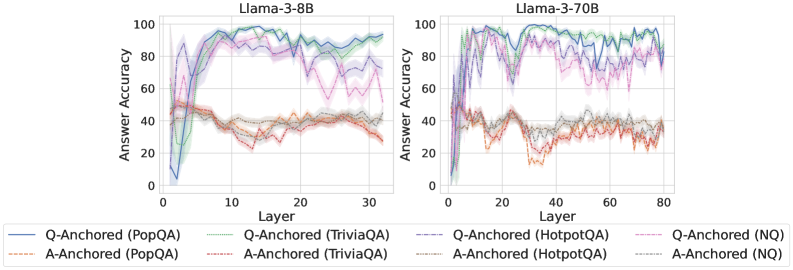
The image presents two line graphs side-by-side, comparing the answer accuracy of two language models, Llama-3-8B and Llama-3-70B, across different layers. Each graph plots the answer accuracy (y-axis) against the layer number (x-axis) for both question-anchored (Q-Anchored) and answer-anchored (A-Anchored) approaches on four different question answering datasets: PopQA, TriviaQA, HotpotQA, and NQ. The graphs include shaded regions around each line, representing the uncertainty or variance in the accuracy.
### Components/Axes
* **Titles:**
* Left Graph: "Llama-3-8B"
* Right Graph: "Llama-3-70B"
* **X-axis:**
* Label: "Layer"
* Left Graph: Scale from 0 to 30, with tick marks at approximately 0, 10, 20, and 30.
* Right Graph: Scale from 0 to 80, with tick marks at approximately 0, 20, 40, 60, and 80.
* **Y-axis:**
* Label: "Answer Accuracy"
* Scale: 0 to 100, with tick marks at 0, 20, 40, 60, 80, and 100.
* **Legend:** Located at the bottom of the image.
* **Q-Anchored (PopQA):** Solid blue line
* **A-Anchored (PopQA):** Dashed brown line
* **Q-Anchored (TriviaQA):** Solid green line
* **A-Anchored (TriviaQA):** Dashed brown line
* **Q-Anchored (HotpotQA):** Solid purple line
* **A-Anchored (HotpotQA):** Dashed brown line
* **Q-Anchored (NQ):** Dashed pink line
* **A-Anchored (NQ):** Dashed brown line
### Detailed Analysis
**Left Graph: Llama-3-8B**
* **Q-Anchored (PopQA):** (Solid Blue) Starts at approximately 0 accuracy, rises sharply to around 80 by layer 5, and then plateaus between 80 and 100 for the remaining layers.
* **A-Anchored (PopQA):** (Dashed Brown) Starts at approximately 50 accuracy, decreases to around 40 by layer 10, and then fluctuates between 30 and 50 for the remaining layers.
* **Q-Anchored (TriviaQA):** (Solid Green) Starts at approximately 20 accuracy, rises sharply to around 80 by layer 5, and then plateaus between 80 and 100 for the remaining layers.
* **A-Anchored (TriviaQA):** (Dashed Brown) Starts at approximately 50 accuracy, decreases to around 40 by layer 10, and then fluctuates between 30 and 50 for the remaining layers.
* **Q-Anchored (HotpotQA):** (Solid Purple) Starts at approximately 50 accuracy, rises sharply to around 80 by layer 5, and then plateaus between 80 and 100 for the remaining layers.
* **A-Anchored (HotpotQA):** (Dashed Brown) Starts at approximately 50 accuracy, decreases to around 40 by layer 10, and then fluctuates between 30 and 50 for the remaining layers.
* **Q-Anchored (NQ):** (Dashed Pink) Starts at approximately 50 accuracy, rises sharply to around 80 by layer 5, and then plateaus between 80 and 100 for the remaining layers.
* **A-Anchored (NQ):** (Dashed Brown) Starts at approximately 50 accuracy, decreases to around 40 by layer 10, and then fluctuates between 30 and 50 for the remaining layers.
**Right Graph: Llama-3-70B**
* **Q-Anchored (PopQA):** (Solid Blue) Starts at approximately 0 accuracy, rises sharply to around 80 by layer 10, and then fluctuates between 80 and 100 for the remaining layers.
* **A-Anchored (PopQA):** (Dashed Brown) Starts at approximately 50 accuracy, decreases to around 40 by layer 20, and then fluctuates between 20 and 50 for the remaining layers.
* **Q-Anchored (TriviaQA):** (Solid Green) Starts at approximately 20 accuracy, rises sharply to around 80 by layer 10, and then fluctuates between 80 and 100 for the remaining layers.
* **A-Anchored (TriviaQA):** (Dashed Brown) Starts at approximately 50 accuracy, decreases to around 40 by layer 20, and then fluctuates between 20 and 50 for the remaining layers.
* **Q-Anchored (HotpotQA):** (Solid Purple) Starts at approximately 50 accuracy, rises sharply to around 80 by layer 10, and then fluctuates between 80 and 100 for the remaining layers.
* **A-Anchored (HotpotQA):** (Dashed Brown) Starts at approximately 50 accuracy, decreases to around 40 by layer 20, and then fluctuates between 20 and 50 for the remaining layers.
* **Q-Anchored (NQ):** (Dashed Pink) Starts at approximately 50 accuracy, rises sharply to around 80 by layer 10, and then fluctuates between 80 and 100 for the remaining layers.
* **A-Anchored (NQ):** (Dashed Brown) Starts at approximately 50 accuracy, decreases to around 40 by layer 20, and then fluctuates between 20 and 50 for the remaining layers.
### Key Observations
* For both models, Q-Anchored approaches (PopQA, TriviaQA, HotpotQA, and NQ) generally achieve higher answer accuracy than A-Anchored approaches.
* The Llama-3-70B model, with more layers, shows a more gradual increase in accuracy for Q-Anchored approaches compared to the Llama-3-8B model.
* The A-Anchored approaches show a similar trend across both models, starting at around 50 accuracy and then decreasing and fluctuating between 20 and 50.
* The shaded regions indicate the variance in accuracy, which appears to be larger in the Llama-3-70B model, especially for the Q-Anchored approaches.
### Interpretation
The data suggests that question-anchoring is a more effective strategy for achieving high answer accuracy in these language models compared to answer-anchoring. The larger Llama-3-70B model, while showing a more gradual increase in accuracy, ultimately achieves similar performance to the smaller Llama-3-8B model for Q-Anchored approaches. The consistent performance of A-Anchored approaches across both models suggests that this strategy may be less sensitive to model size. The larger variance in accuracy for the Llama-3-70B model could be due to its increased complexity and potential for overfitting. The similar brown dashed line for all A-Anchored approaches suggests that the dataset has little impact on the A-Anchored accuracy.