## Line Charts: Answer Accuracy Across Layers for Llama-3 Models
### Overview
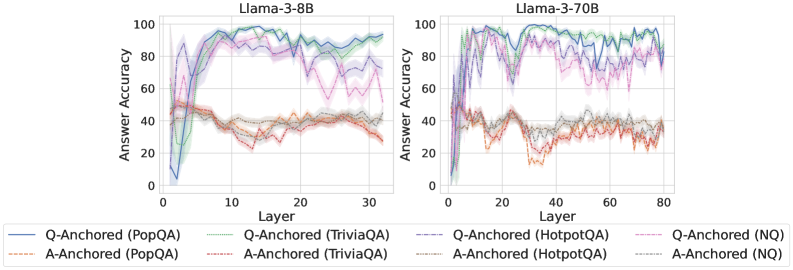
The image displays two side-by-side line charts comparing the "Answer Accuracy" of two Large Language Models (LLMs)—Llama-3-8B and Llama-3-70B—across their internal layers. The performance is measured on four different question-answering (QA) datasets using two distinct prompting or anchoring methods: "Q-Anchored" and "A-Anchored." The charts illustrate how model performance evolves from early to late layers.
### Components/Axes
* **Chart Titles:** "Llama-3-8B" (left chart), "Llama-3-70B" (right chart).
* **Y-Axis (Both Charts):** Label: "Answer Accuracy". Scale: 0 to 100, with major tick marks at intervals of 20 (0, 20, 40, 60, 80, 100).
* **X-Axis (Left Chart - Llama-3-8B):** Label: "Layer". Scale: 0 to 30, with major tick marks at intervals of 10 (0, 10, 20, 30).
* **X-Axis (Right Chart - Llama-3-70B):** Label: "Layer". Scale: 0 to 80, with major tick marks at intervals of 20 (0, 20, 40, 60, 80).
* **Legend (Bottom, spanning both charts):** Contains eight entries, each defined by a line style and color:
1. `Q-Anchored (PopQA)`: Solid blue line.
2. `Q-Anchored (TriviaQA)`: Solid green line.
3. `Q-Anchored (HotpotQA)`: Dashed purple line.
4. `Q-Anchored (NQ)`: Dotted pink line.
5. `A-Anchored (PopQA)`: Dash-dot orange line.
6. `A-Anchored (TriviaQA)`: Dash-dot red line.
7. `A-Anchored (HotpotQA)`: Dash-dot gray line.
8. `A-Anchored (NQ)`: Dash-dot light blue line.
### Detailed Analysis
**Llama-3-8B (Left Chart):**
* **Q-Anchored Series (Solid/Dashed/Dotted Lines):** All four datasets show a similar trend. Accuracy starts very low (near 0-10%) at layer 0, rises sharply to a peak between layers 10-20 (reaching ~90-95% for PopQA/TriviaQA, ~85-90% for HotpotQA/NQ), and then gradually declines or stabilizes at a slightly lower level (~80-90%) towards layer 30. The `Q-Anchored (PopQA)` (solid blue) and `Q-Anchored (TriviaQA)` (solid green) lines are consistently the top performers.
* **A-Anchored Series (Dash-dot Lines):** These series exhibit significantly lower accuracy throughout. They start around 40-50% at layer 0, show a slight dip in the early layers (10-15), and then fluctuate between approximately 30% and 45% for the remainder of the layers. There is no strong upward trend; performance remains relatively flat and noisy. The `A-Anchored (TriviaQA)` (dash-dot red) line appears to be the lowest-performing series overall.
**Llama-3-70B (Right Chart):**
* **Q-Anchored Series:** The pattern is more volatile but follows a similar arc. Accuracy climbs rapidly from layer 0, reaching high levels (>80%) by layer 10. Performance peaks in the middle layers (approximately 20-50), with `Q-Anchored (PopQA)` and `Q-Anchored (TriviaQA)` frequently hitting near 100% accuracy. After layer 50, there is a noticeable downward trend for all Q-Anchored series, ending between 70-90% at layer 80. The lines show more pronounced dips and recoveries compared to the 8B model.
* **A-Anchored Series:** Similar to the 8B model, these series perform poorly. They start around 30-40%, dip to their lowest points (some near 10-20%) between layers 20-40, and then recover slightly to fluctuate between 20-40% for the later layers. The `A-Anchored (TriviaQA)` (dash-dot red) line again shows some of the lowest accuracy values.
### Key Observations
1. **Dominant Performance Gap:** There is a stark and consistent separation between the Q-Anchored and A-Anchored methods across both models and all datasets. Q-Anchored prompting yields dramatically higher answer accuracy.
2. **Layer-Wise Arc:** For the effective Q-Anchored method, performance follows an arc: low in very early layers, peaking in the middle layers, and often declining slightly in the final layers. This suggests the model's "knowledge" or answer formulation is most accessible in its intermediate processing stages.
3. **Model Scale Effect:** The larger Llama-3-70B model achieves higher peak accuracies (near 100% for some datasets) but also exhibits greater volatility and a more pronounced late-layer decline compared to the smaller Llama-3-8B.
4. **Dataset Hierarchy:** For Q-Anchored evaluation, PopQA and TriviaQA consistently yield the highest accuracy, followed by HotpotQA and NQ. This ordering is maintained across both models.
5. **A-Anchored Instability:** The A-Anchored lines are not only lower but also noisier, with significant dips, particularly in the 70B model around layers 20-40.
### Interpretation
The data strongly suggests that the **method of anchoring or prompting (Q-Anchored vs. A-Anchored) is a far more critical factor for extracting accurate answers from these Llama-3 models than the model size or the specific QA dataset.** The Q-Anchored method, which likely involves framing the query in a specific way relative to the model's internal representations, successfully activates the model's parametric knowledge stored in its middle layers.
The observed arc—low early, peak middle, slight decline late—provides a Peircean insight into the model's information processing. The early layers are likely performing low-level feature extraction, the middle layers integrate this into high-level semantic representations where answers are most readily accessible, and the final layers may be specializing for next-token prediction in a way that slightly obfuscates the direct answer retrieval measured here.
The greater volatility and higher peak in the 70B model could indicate that its larger capacity allows for more specialized and powerful internal representations (leading to near-perfect scores) but also makes the retrieval process more sensitive to the specific layer, resulting in less stable performance across the network. The consistently poor performance of A-Anchored methods implies that this approach fails to properly interface with the models' knowledge stores, possibly by providing the wrong type of cue or context.