## Line Graph: Answer Accuracy Across Layers for Llama-3-8B and Llama-3-70B Models
### Overview
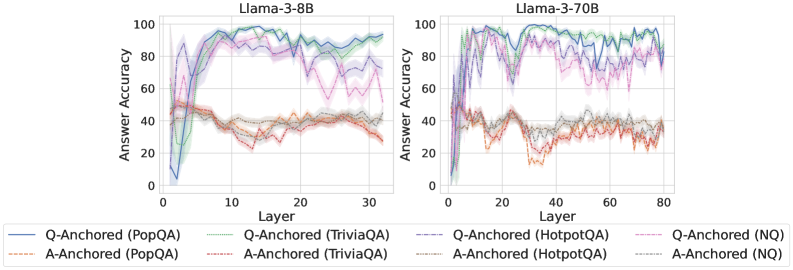
The image compares answer accuracy across layers (0–30 for Llama-3-8B, 0–80 for Llama-3-70B) for two model sizes. It evaluates four datasets (PopQA, TriviaQA, HotpotQA, NQ) using two anchoring methods: Q-Anchored (question-focused) and A-Anchored (answer-focused). Accuracy is measured as a percentage (0–100%).
### Components/Axes
- **X-axis**: Layer (0–30 for Llama-3-8B, 0–80 for Llama-3-70B).
- **Y-axis**: Answer Accuracy (%) (0–100).
- **Legends**:
- **Llama-3-8B**:
- Blue: Q-Anchored (PopQA)
- Green: Q-Anchored (TriviaQA)
- Orange: A-Anchored (PopQA)
- Red: A-Anchored (TriviaQA)
- **Llama-3-70B**:
- Purple: Q-Anchored (HotpotQA)
- Pink: Q-Anchored (NQ)
- Gray: A-Anchored (HotpotQA)
- Brown: A-Anchored (NQ)
### Detailed Analysis
#### Llama-3-8B (Left Chart)
- **Q-Anchored (PopQA, Blue)**:
- Starts at ~80% (layer 0), dips to ~60% (layer 10), peaks at ~90% (layer 20), then stabilizes at ~85% (layer 30).
- **Q-Anchored (TriviaQA, Green)**:
- Begins at ~70%, rises to ~85% (layer 10), fluctuates between ~75–85% (layers 20–30).
- **A-Anchored (PopQA, Orange)**:
- Starts at ~40%, drops to ~20% (layer 10), recovers to ~50% (layer 30).
- **A-Anchored (TriviaQA, Red)**:
- Begins at ~50%, dips to ~30% (layer 10), rises to ~60% (layer 30).
#### Llama-3-70B (Right Chart)
- **Q-Anchored (HotpotQA, Purple)**:
- Starts at ~85%, fluctuates between ~70–90% (layers 0–40), stabilizes at ~80% (layers 60–80).
- **Q-Anchored (NQ, Pink)**:
- Begins at ~75%, dips to ~60% (layer 20), rises to ~85% (layer 60), then drops to ~70% (layer 80).
- **A-Anchored (HotpotQA, Gray)**:
- Starts at ~50%, fluctuates between ~40–60% (layers 0–60), stabilizes at ~55% (layers 60–80).
- **A-Anchored (NQ, Brown)**:
- Begins at ~40%, dips to ~30% (layer 20), rises to ~50% (layer 60), then drops to ~45% (layer 80).
### Key Observations
1. **Model Size Impact**:
- Llama-3-70B shows smoother trends and higher baseline accuracy (e.g., Q-Anchored HotpotQA peaks at ~90%) compared to Llama-3-8B.
2. **Anchoring Method**:
- Q-Anchored methods generally outperform A-Anchored (e.g., Q-Anchored PopQA in Llama-3-8B reaches ~90% vs. A-Anchored PopQA at ~50%).
3. **Dataset Variability**:
- NQ dataset exhibits the most erratic trends (e.g., Q-Anchored NQ in Llama-3-70B drops from ~85% to ~70% across layers).
4. **Layer Sensitivity**:
- Both models show accuracy dips in mid-layers (e.g., layer 10–20 for Llama-3-8B), suggesting potential architectural bottlenecks.
### Interpretation
The data suggests that larger models (Llama-3-70B) maintain higher and more stable accuracy across layers, particularly with Q-Anchored methods. Q-Anchored approaches consistently outperform A-Anchored, likely due to better alignment with question context. The NQ dataset’s volatility may reflect its complexity or noise. Mid-layer dips in both models hint at architectural trade-offs, where certain layers prioritize efficiency over accuracy. The 70B model’s smoother curves imply better generalization, while the 8B model’s sharper fluctuations suggest sensitivity to layer depth.