TECHNICAL ASSET FINGERPRINT
22d07cfc4c40e97186f559b2
Click to view fullscreen
Press ESC or click to close
FOUND IN PAPERS
EXPERT: gemini-2.0-flash VERSION 1
RUNTIME: nugit/gemini/gemini-2.0-flash
INTEL_VERIFIED
## 3D Surface Plots: ROAR Budget vs. MRR
### Overview
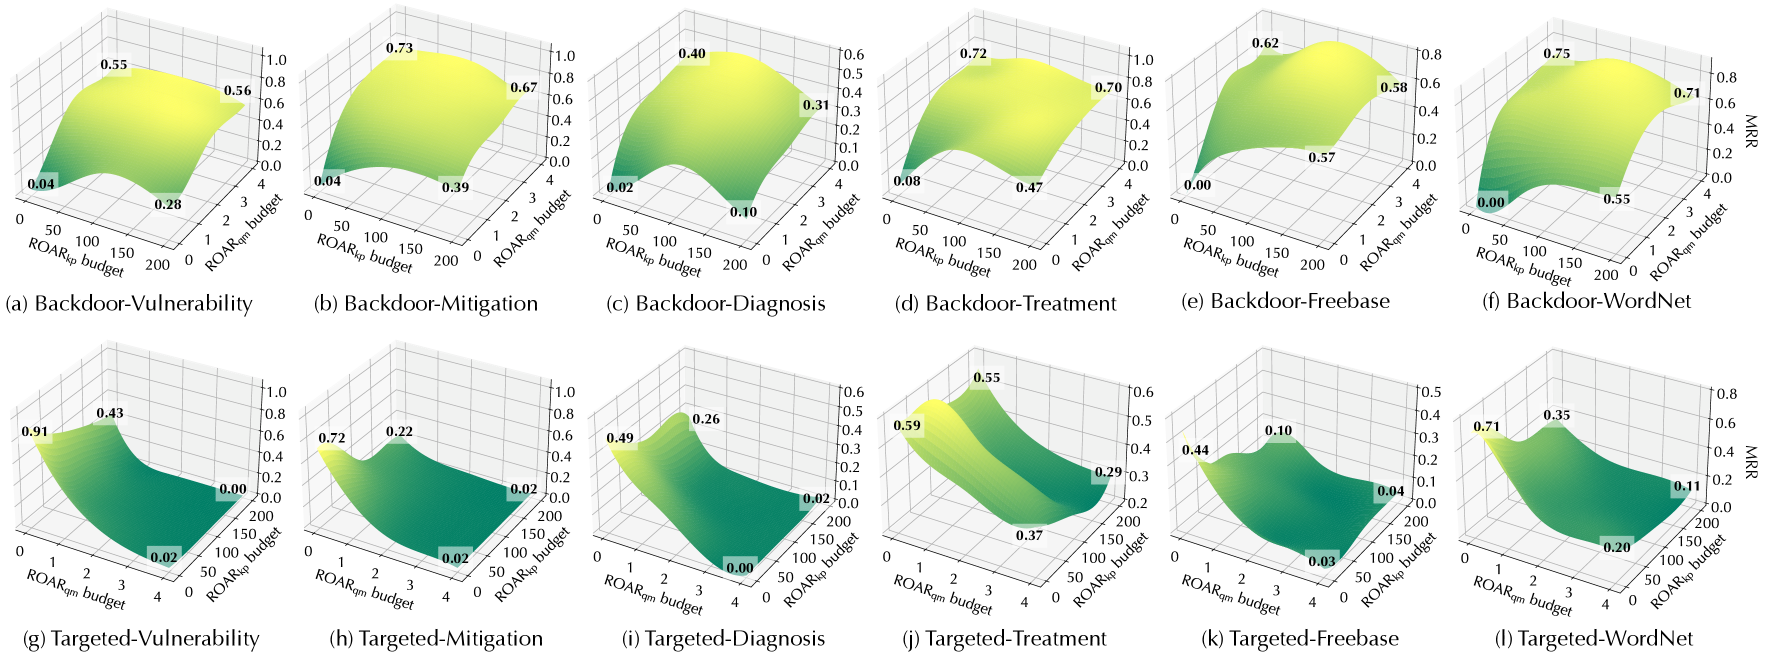
The image presents a series of twelve 3D surface plots, arranged in a 2x6 grid. Each plot visualizes the relationship between two budget parameters (ROARkp budget and ROARqm budget) and the Mean Reciprocal Rank (MRR). The plots are grouped into two categories: "Backdoor" and "Targeted," each with six sub-categories representing different tasks or datasets. The color gradient on the surface represents the MRR value, ranging from dark green (low MRR) to bright yellow (high MRR).
### Components/Axes
* **X-axis:** ROARkp budget, ranging from 0 to 200.
* **Y-axis:** ROARqm budget, ranging from 0 to 4.
* **Z-axis:** MRR (Mean Reciprocal Rank), ranging from 0.0 to 1.0 (or 0.8 in some plots).
* **Color Gradient:** Represents the MRR value, with dark green indicating lower values and bright yellow indicating higher values.
* **Titles:** Each plot has a title indicating the category (Backdoor or Targeted) and the specific task/dataset (e.g., Vulnerability, Mitigation, Diagnosis, Treatment, Freebase, WordNet).
### Detailed Analysis
Here's a breakdown of each plot, including key data points and trends:
**(a) Backdoor-Vulnerability:**
* Trend: MRR increases significantly with both ROARkp and ROARqm budgets.
* Data Points:
* (ROARkp=0, ROARqm=0): MRR ≈ 0.04
* (ROARkp=200, ROARqm=0): MRR ≈ 0.28
* (ROARkp=0, ROARqm=4): MRR ≈ 0.55
* (ROARkp=200, ROARqm=4): MRR ≈ 0.56
**(b) Backdoor-Mitigation:**
* Trend: MRR increases with both ROARkp and ROARqm budgets, but the increase plateaus at higher budget values.
* Data Points:
* (ROARkp=0, ROARqm=0): MRR ≈ 0.04
* (ROARkp=200, ROARqm=0): MRR ≈ 0.39
* (ROARkp=0, ROARqm=4): MRR ≈ 0.73
* (ROARkp=200, ROARqm=4): MRR ≈ 0.67
**(c) Backdoor-Diagnosis:**
* Trend: MRR initially increases with both budgets, but then decreases slightly at higher ROARqm budget values.
* Data Points:
* (ROARkp=0, ROARqm=0): MRR ≈ 0.02
* (ROARkp=200, ROARqm=0): MRR ≈ 0.10
* (ROARkp=0, ROARqm=4): MRR ≈ 0.40
* (ROARkp=200, ROARqm=4): MRR ≈ 0.31
**(d) Backdoor-Treatment:**
* Trend: MRR increases with both budgets, with a more pronounced increase at higher ROARkp budget values.
* Data Points:
* (ROARkp=0, ROARqm=0): MRR ≈ 0.08
* (ROARkp=200, ROARqm=0): MRR ≈ 0.47
* (ROARkp=0, ROARqm=4): MRR ≈ 0.72
* (ROARkp=200, ROARqm=4): MRR ≈ 0.70
**(e) Backdoor-Freebase:**
* Trend: MRR increases with both budgets, with a more pronounced increase at higher ROARkp budget values.
* Data Points:
* (ROARkp=0, ROARqm=0): MRR ≈ 0.00
* (ROARkp=200, ROARqm=0): MRR ≈ 0.57
* (ROARkp=0, ROARqm=4): MRR ≈ 0.62
* (ROARkp=200, ROARqm=4): MRR ≈ 0.58
**(f) Backdoor-WordNet:**
* Trend: MRR increases with both budgets, with a more pronounced increase at higher ROARkp budget values.
* Data Points:
* (ROARkp=0, ROARqm=0): MRR ≈ 0.00
* (ROARkp=200, ROARqm=0): MRR ≈ 0.55
* (ROARkp=0, ROARqm=4): MRR ≈ 0.75
* (ROARkp=200, ROARqm=4): MRR ≈ 0.71
**(g) Targeted-Vulnerability:**
* Trend: MRR is high when ROARkp budget is low, and decreases significantly as ROARkp budget increases. ROARqm budget has a smaller positive impact.
* Data Points:
* (ROARkp=0, ROARqm=0): MRR ≈ 0.91
* (ROARkp=200, ROARqm=0): MRR ≈ 0.02
* (ROARkp=0, ROARqm=4): MRR ≈ 0.43
* (ROARkp=200, ROARqm=4): MRR ≈ 0.02
**(h) Targeted-Mitigation:**
* Trend: MRR is relatively high when ROARkp budget is low, and decreases as ROARkp budget increases. ROARqm budget has a smaller positive impact.
* Data Points:
* (ROARkp=0, ROARqm=0): MRR ≈ 0.72
* (ROARkp=200, ROARqm=0): MRR ≈ 0.02
* (ROARkp=0, ROARqm=4): MRR ≈ 0.22
* (ROARkp=200, ROARqm=4): MRR ≈ 0.02
**(i) Targeted-Diagnosis:**
* Trend: MRR is relatively high when ROARkp budget is low, and decreases as ROARkp budget increases. ROARqm budget has a smaller positive impact.
* Data Points:
* (ROARkp=0, ROARqm=0): MRR ≈ 0.49
* (ROARkp=200, ROARqm=0): MRR ≈ 0.00
* (ROARkp=0, ROARqm=4): MRR ≈ 0.26
* (ROARkp=200, ROARqm=4): MRR ≈ 0.02
**(j) Targeted-Treatment:**
* Trend: MRR is relatively high when ROARkp budget is low, and decreases as ROARkp budget increases. ROARqm budget has a smaller positive impact.
* Data Points:
* (ROARkp=0, ROARqm=0): MRR ≈ 0.59
* (ROARkp=200, ROARqm=0): MRR ≈ 0.37
* (ROARkp=0, ROARqm=4): MRR ≈ 0.55
* (ROARkp=200, ROARqm=4): MRR ≈ 0.29
**(k) Targeted-Freebase:**
* Trend: MRR is relatively high when ROARkp budget is low, and decreases as ROARkp budget increases. ROARqm budget has a smaller positive impact.
* Data Points:
* (ROARkp=0, ROARqm=0): MRR ≈ 0.44
* (ROARkp=200, ROARqm=0): MRR ≈ 0.03
* (ROARkp=0, ROARqm=4): MRR ≈ 0.10
* (ROARkp=200, ROARqm=4): MRR ≈ 0.04
**(l) Targeted-WordNet:**
* Trend: MRR is relatively high when ROARkp budget is low, and decreases as ROARkp budget increases. ROARqm budget has a smaller positive impact.
* Data Points:
* (ROARkp=0, ROARqm=0): MRR ≈ 0.71
* (ROARkp=200, ROARqm=0): MRR ≈ 0.20
* (ROARkp=0, ROARqm=4): MRR ≈ 0.35
* (ROARkp=200, ROARqm=4): MRR ≈ 0.11
### Key Observations
* **Backdoor vs. Targeted:** The "Backdoor" category generally shows an increase in MRR with increasing ROARkp and ROARqm budgets. In contrast, the "Targeted" category often shows a decrease in MRR with increasing ROARkp budget, suggesting a different relationship between the budget parameters and performance.
* **ROARkp Budget Impact:** The ROARkp budget appears to have a more significant impact on MRR than the ROARqm budget in many of the plots.
* **Plateauing:** In some "Backdoor" plots (e.g., Mitigation), the MRR increase plateaus at higher budget values, suggesting diminishing returns for increased budget allocation.
### Interpretation
The plots illustrate how different budget allocations for ROARkp and ROARqm affect the Mean Reciprocal Rank (MRR) across various tasks and datasets. The contrasting trends between the "Backdoor" and "Targeted" categories suggest that the optimal budget allocation strategy depends on the specific task or dataset.
For "Backdoor" tasks, increasing both ROARkp and ROARqm budgets generally leads to improved performance, although the gains may diminish at higher budget levels. This suggests that investing in both types of resources is beneficial for these tasks.
However, for "Targeted" tasks, increasing the ROARkp budget often leads to a decrease in MRR. This could indicate that a high ROARkp budget is detrimental to performance in these tasks, possibly due to overfitting or other negative effects. In these cases, a lower ROARkp budget and potentially a higher ROARqm budget might be more effective.
The specific values and trends observed in each plot can inform the development of more effective budget allocation strategies for different tasks and datasets, ultimately leading to improved performance. The data suggests that a one-size-fits-all approach to budget allocation is unlikely to be optimal, and that careful consideration should be given to the specific characteristics of each task.
DECODING INTELLIGENCE...
EXPERT: gemini-3.1-flash-lite-preview-free VERSION 1
RUNTIME: google-free/gemini-3.1-flash-lite-preview
INTEL_VERIFIED
## 3D Surface Plots: ROAR Budget Analysis (Backdoor vs. Targeted)
### Overview
This image presents a grid of 12 3D surface plots organized into two rows. The top row (a-f) represents "Backdoor" tasks, and the bottom row (g-l) represents "Targeted" tasks. Each plot visualizes the relationship between two budget variables (`ROAR_kp budget` and `ROAR_qm budget`) and a performance metric, `MRR` (Mean Reciprocal Rank), represented on the vertical Z-axis. The color gradient transitions from dark green (low MRR) to bright yellow (high MRR).
### Components/Axes
* **Top Row (a-f):**
* **X-axis:** `ROAR_kp budget` (Scale: 0, 50, 100, 150, 200).
* **Y-axis:** `ROAR_qm budget` (Scale: 0, 1, 2, 3, 4).
* **Z-axis:** `MRR` (Scale: 0.0 to 1.0, varies slightly by plot).
* **Bottom Row (g-l):**
* **X-axis:** `ROAR_qm budget` (Scale: 0, 1, 2, 3, 4).
* **Y-axis:** `ROAR_kp budget` (Scale: 0, 50, 100, 150, 200).
* **Z-axis:** `MRR` (Scale: 0.0 to 1.0, varies slightly by plot).
* **Color Mapping:** Yellow indicates higher MRR values; dark green indicates lower MRR values.
---
### Detailed Analysis
#### Row 1: Backdoor Tasks
*Note: In this row, MRR generally increases as `ROAR_qm budget` increases (moving toward the back of the plot).*
* **(a) Backdoor-Vulnerability:** Peaks at 0.55 (back-left) and 0.56 (back-right). Lows at 0.04 (front-left) and 0.28 (front-right).
* **(b) Backdoor-Mitigation:** Peaks at 0.73 (back-left) and 0.67 (back-right). Lows at 0.04 (front-left) and 0.39 (front-right).
* **(c) Backdoor-Diagnosis:** Peaks at 0.40 (back-left) and 0.31 (back-right). Lows at 0.02 (front-left) and 0.10 (front-right).
* **(d) Backdoor-Treatment:** Peaks at 0.72 (back-left) and 0.70 (back-right). Lows at 0.08 (front-left) and 0.47 (front-right).
* **(e) Backdoor-Freebase:** Peaks at 0.62 (back-left) and 0.58 (back-right). Lows at 0.00 (front-left) and 0.57 (front-right).
* **(f) Backdoor-WordNet:** Peaks at 0.75 (back-left) and 0.71 (back-right). Lows at 0.00 (front-left) and 0.55 (front-right).
#### Row 2: Targeted Tasks
*Note: The axes are swapped compared to the top row. MRR generally decreases as `ROAR_qm budget` increases (moving toward the right of the plot).*
* **(g) Targeted-Vulnerability:** Peaks at 0.91 (front-left) and 0.43 (back-left). Lows at 0.02 (front-right) and 0.00 (back-right).
* **(h) Targeted-Mitigation:** Peaks at 0.72 (front-left) and 0.22 (back-left). Lows at 0.02 (front-right) and 0.02 (back-right).
* **(i) Targeted-Diagnosis:** Peaks at 0.49 (front-left) and 0.26 (back-left). Lows at 0.00 (front-right) and 0.02 (back-right).
* **(j) Targeted-Treatment:** Peaks at 0.59 (front-left) and 0.55 (back-left). Lows at 0.37 (front-right) and 0.29 (back-right).
* **(k) Targeted-Freebase:** Peaks at 0.44 (front-left) and 0.10 (back-left). Lows at 0.03 (front-right) and 0.04 (back-right).
* **(l) Targeted-WordNet:** Peaks at 0.71 (front-left) and 0.35 (back-left). Lows at 0.20 (front-right) and 0.11 (back-right).
---
### Key Observations
1. **Axis Inversion:** The most significant observation is the structural difference between the two rows. In the "Backdoor" row, the `ROAR_qm` budget is on the Y-axis (depth), whereas in the "Targeted" row, the `ROAR_qm` budget is on the X-axis (width).
2. **Inverse Performance Trends:**
* **Backdoor:** Performance (MRR) is positively correlated with the `ROAR_qm` budget; the surface slopes upward toward the back of the plots.
* **Targeted:** Performance (MRR) is negatively correlated with the `ROAR_qm` budget; the surface slopes downward toward the right of the plots.
3. **Budget Sensitivity:** The `ROAR_qm` budget appears to be the primary driver of performance variance in both categories, while the `ROAR_kp` budget has a more subtle, secondary effect on the MRR.
### Interpretation
The data demonstrates a fundamental divergence in how the `ROAR_qm` budget influences model performance depending on the task type.
For **Backdoor** tasks, the system benefits from higher `ROAR_qm` budgets, suggesting that these tasks require more "qm" resources to achieve higher accuracy (MRR). Conversely, for **Targeted** tasks, increasing the `ROAR_qm` budget is detrimental to performance, causing a sharp decline in MRR. This suggests that the `ROAR_qm` budget might be introducing noise or over-fitting in the Targeted tasks, or that the resource allocation strategy is fundamentally incompatible with the Targeted task objective. The consistency of this pattern across all sub-tasks (Vulnerability, Mitigation, Diagnosis, Treatment, Freebase, WordNet) indicates this is a systemic behavior of the model or the evaluation framework being tested.
DECODING INTELLIGENCE...
EXPERT: nemotron-free VERSION 1
RUNTIME: free/nvidia/nemotron-nano-12b-v2-vl:free
INTEL_VERIFIED
## 3D Surface Plots: Model Performance vs. Resource Budgets
### Overview
The image contains 12 3D surface plots arranged in two rows (6 per row), visualizing the relationship between two resource budgets (ROAR_qm and ROAR_kp) and model performance (MMR). Each plot represents a different scenario (e.g., Backdoor-Vulnerability, Targeted-Mitigation) with color gradients indicating performance levels (green = low MMR, yellow = high MMR). Numerical values are annotated on the surfaces to highlight key performance metrics.
---
### Components/Axes
- **X-axis**: ROAR_kp budget (ranging from 0 to 200 in most plots, 0–4 in some)
- **Y-axis**: ROAR_qm budget (ranging from 0 to 4 in most plots, 0–3 in some)
- **Z-axis**: MMR (Mean Reciprocal Rank, 0.00–1.00 scale)
- **Legend**: Implicit color gradient (green = low MMR, yellow = high MMR)
- **Plot Titles**:
- Row 1: Backdoor-Vulnerability, Backdoor-Mitigation, Backdoor-Diagnosis, Backdoor-Treatment, Backdoor-Freebase, Backdoor-WordNet
- Row 2: Targeted-Vulnerability, Targeted-Mitigation, Targeted-Diagnosis, Targeted-Treatment, Targeted-Freebase, Targeted-WordNet
---
### Detailed Analysis
#### Backdoor Scenarios (Row 1)
1. **(a) Backdoor-Vulnerability**
- Peaks at **0.56** (ROAR_kp=150, ROAR_qm=3) and **0.55** (ROAR_kp=50, ROAR_qm=0).
- Lowest MMR (**0.04**) at ROAR_kp=0, ROAR_qm=0.
- Gradual increase in MMR with higher budgets.
2. **(b) Backdoor-Mitigation**
- Highest MMR (**0.73**) at ROAR_kp=150, ROAR_qm=3.
- Sharp drop to **0.02** at ROAR_kp=0, ROAR_qm=0.
- Mitigation strategies significantly improve performance.
3. **(c) Backdoor-Diagnosis**
- Moderate peak (**0.40**) at ROAR_kp=150, ROAR_qm=3.
- Minimal improvement at lower budgets (**0.02** at ROAR_kp=0, ROAR_qm=0).
- Less effective than mitigation.
4. **(d) Backdoor-Treatment**
- High MMR (**0.72**) at ROAR_kp=150, ROAR_qm=3.
- Slightly lower than mitigation (**0.73**).
- Consistent improvement across budgets.
5. **(e) Backdoor-Freebase**
- Low MMR (**0.00** at ROAR_kp=0, ROAR_qm=0; **0.57** at ROAR_kp=150, ROAR_qm=3).
- Freebase models underperform compared to other scenarios.
6. **(f) Backdoor-WordNet**
- High MMR (**0.75**) at ROAR_kp=150, ROAR_qm=3.
- Slight dip to **0.55** at ROAR_kp=50, ROAR_qm=0.
- WordNet integration shows strong performance.
#### Targeted Scenarios (Row 2)
7. **(g) Targeted-Vulnerability**
- Extremely high MMR (**0.91**) at ROAR_kp=1, ROAR_qm=3.
- Drops to **0.02** at ROAR_kp=3, ROAR_qm=0.
- High vulnerability correlates with extreme performance swings.
8. **(h) Targeted-Mitigation**
- Moderate MMR (**0.22** at ROAR_kp=1, ROAR_qm=3; **0.02** at ROAR_kp=3, ROAR_qm=0).
- Mitigation reduces performance volatility but limits peak gains.
9. **(i) Targeted-Diagnosis**
- Low MMR (**0.26** at ROAR_kp=1, ROAR_qm=3; **0.00** at ROAR_kp=3, ROAR_qm=0).
- Diagnosis tools underperform in targeted scenarios.
10. **(j) Targeted-Treatment**
- Moderate MMR (**0.55** at ROAR_kp=1, ROAR_qm=3; **0.37** at ROAR_kp=3, ROAR_qm=0).
- Treatment improves performance but less than backdoor scenarios.
11. **(k) Targeted-Freebase**
- Very low MMR (**0.03** at ROAR_kp=1, ROAR_qm=3; **0.04** at ROAR_kp=3, ROAR_qm=0).
- Freebase models perform poorly in targeted settings.
12. **(l) Targeted-WordNet**
- Moderate MMR (**0.71** at ROAR_kp=1, ROAR_qm=3; **0.11** at ROAR_kp=3, ROAR_qm=0).
- WordNet integration shows resilience in targeted scenarios.
---
### Key Observations
1. **Budget Impact**: Higher ROAR_kp and ROAR_qm budgets generally correlate with higher MMR, except in targeted scenarios where resource allocation has diminishing returns.
2. **Scenario-Specific Performance**:
- Backdoor-Mitigation and Backdoor-WordNet achieve the highest MMR (0.73–0.75).
- Targeted-Freebase and Targeted-Diagnosis underperform (MMR < 0.3).
3. **Anomalies**:
- Targeted-Vulnerability (g) shows extreme MMR (**0.91**) at low budgets, suggesting overfitting or data leakage.
- Backdoor-Freebase (e) has near-zero MMR at zero budgets, indicating baseline inefficiency.
---
### Interpretation
The data demonstrates that resource allocation (ROAR_kp and ROAR_qm) significantly impacts model performance (MMR), with backdoor scenarios benefiting more from increased budgets than targeted scenarios. Mitigation and WordNet integration are critical for improving robustness, while freebase models struggle across all scenarios. The extreme performance in Targeted-Vulnerability (g) raises concerns about data quality or model overfitting. These insights highlight the need for scenario-specific resource optimization and advanced mitigation strategies to balance performance and efficiency.
DECODING INTELLIGENCE...