## 3D Surface Plots: ROAR Budget Analysis (Backdoor vs. Targeted)
### Overview
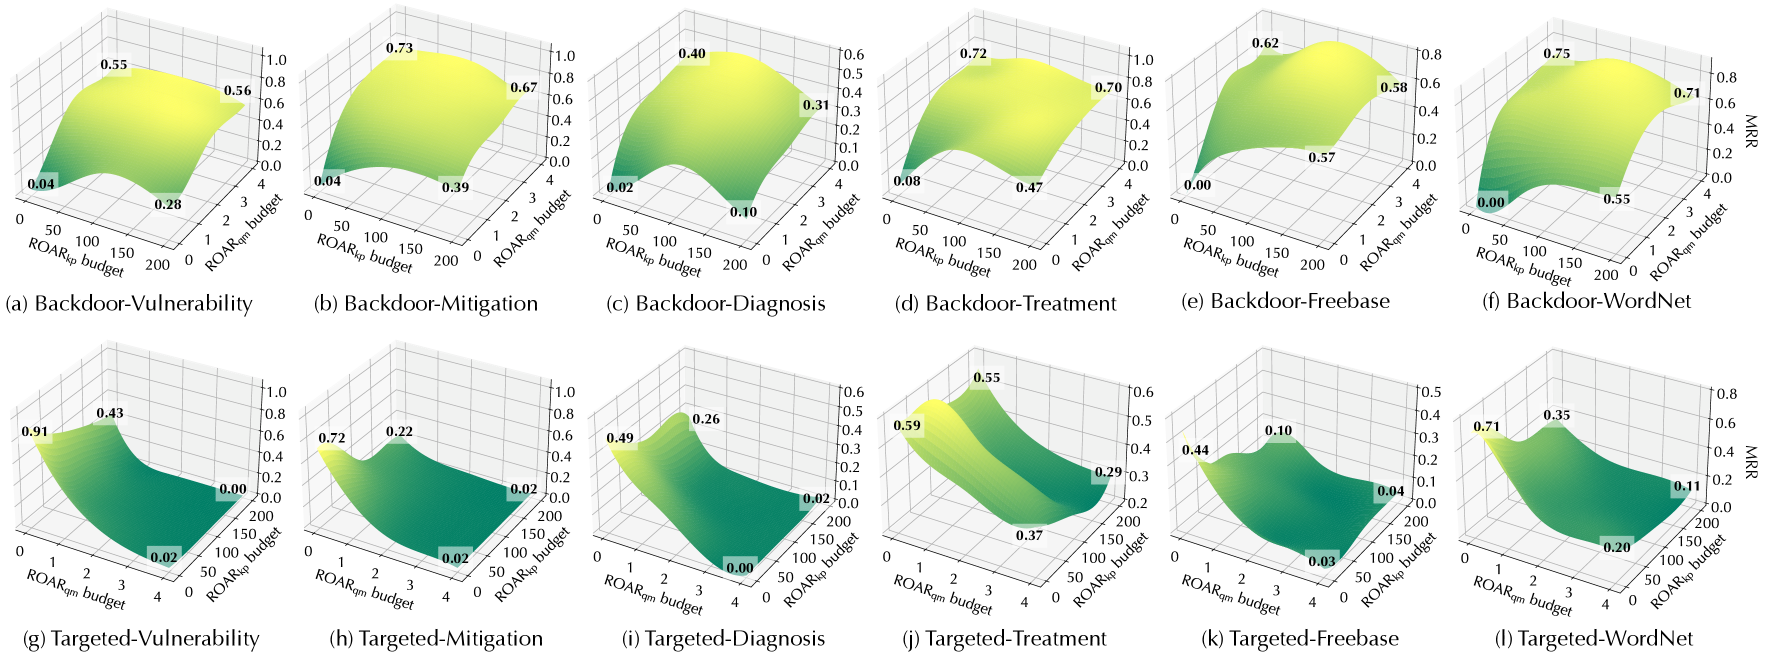
This image presents a grid of 12 3D surface plots organized into two rows. The top row (a-f) represents "Backdoor" tasks, and the bottom row (g-l) represents "Targeted" tasks. Each plot visualizes the relationship between two budget variables (`ROAR_kp budget` and `ROAR_qm budget`) and a performance metric, `MRR` (Mean Reciprocal Rank), represented on the vertical Z-axis. The color gradient transitions from dark green (low MRR) to bright yellow (high MRR).
### Components/Axes
* **Top Row (a-f):**
* **X-axis:** `ROAR_kp budget` (Scale: 0, 50, 100, 150, 200).
* **Y-axis:** `ROAR_qm budget` (Scale: 0, 1, 2, 3, 4).
* **Z-axis:** `MRR` (Scale: 0.0 to 1.0, varies slightly by plot).
* **Bottom Row (g-l):**
* **X-axis:** `ROAR_qm budget` (Scale: 0, 1, 2, 3, 4).
* **Y-axis:** `ROAR_kp budget` (Scale: 0, 50, 100, 150, 200).
* **Z-axis:** `MRR` (Scale: 0.0 to 1.0, varies slightly by plot).
* **Color Mapping:** Yellow indicates higher MRR values; dark green indicates lower MRR values.
---
### Detailed Analysis
#### Row 1: Backdoor Tasks
*Note: In this row, MRR generally increases as `ROAR_qm budget` increases (moving toward the back of the plot).*
* **(a) Backdoor-Vulnerability:** Peaks at 0.55 (back-left) and 0.56 (back-right). Lows at 0.04 (front-left) and 0.28 (front-right).
* **(b) Backdoor-Mitigation:** Peaks at 0.73 (back-left) and 0.67 (back-right). Lows at 0.04 (front-left) and 0.39 (front-right).
* **(c) Backdoor-Diagnosis:** Peaks at 0.40 (back-left) and 0.31 (back-right). Lows at 0.02 (front-left) and 0.10 (front-right).
* **(d) Backdoor-Treatment:** Peaks at 0.72 (back-left) and 0.70 (back-right). Lows at 0.08 (front-left) and 0.47 (front-right).
* **(e) Backdoor-Freebase:** Peaks at 0.62 (back-left) and 0.58 (back-right). Lows at 0.00 (front-left) and 0.57 (front-right).
* **(f) Backdoor-WordNet:** Peaks at 0.75 (back-left) and 0.71 (back-right). Lows at 0.00 (front-left) and 0.55 (front-right).
#### Row 2: Targeted Tasks
*Note: The axes are swapped compared to the top row. MRR generally decreases as `ROAR_qm budget` increases (moving toward the right of the plot).*
* **(g) Targeted-Vulnerability:** Peaks at 0.91 (front-left) and 0.43 (back-left). Lows at 0.02 (front-right) and 0.00 (back-right).
* **(h) Targeted-Mitigation:** Peaks at 0.72 (front-left) and 0.22 (back-left). Lows at 0.02 (front-right) and 0.02 (back-right).
* **(i) Targeted-Diagnosis:** Peaks at 0.49 (front-left) and 0.26 (back-left). Lows at 0.00 (front-right) and 0.02 (back-right).
* **(j) Targeted-Treatment:** Peaks at 0.59 (front-left) and 0.55 (back-left). Lows at 0.37 (front-right) and 0.29 (back-right).
* **(k) Targeted-Freebase:** Peaks at 0.44 (front-left) and 0.10 (back-left). Lows at 0.03 (front-right) and 0.04 (back-right).
* **(l) Targeted-WordNet:** Peaks at 0.71 (front-left) and 0.35 (back-left). Lows at 0.20 (front-right) and 0.11 (back-right).
---
### Key Observations
1. **Axis Inversion:** The most significant observation is the structural difference between the two rows. In the "Backdoor" row, the `ROAR_qm` budget is on the Y-axis (depth), whereas in the "Targeted" row, the `ROAR_qm` budget is on the X-axis (width).
2. **Inverse Performance Trends:**
* **Backdoor:** Performance (MRR) is positively correlated with the `ROAR_qm` budget; the surface slopes upward toward the back of the plots.
* **Targeted:** Performance (MRR) is negatively correlated with the `ROAR_qm` budget; the surface slopes downward toward the right of the plots.
3. **Budget Sensitivity:** The `ROAR_qm` budget appears to be the primary driver of performance variance in both categories, while the `ROAR_kp` budget has a more subtle, secondary effect on the MRR.
### Interpretation
The data demonstrates a fundamental divergence in how the `ROAR_qm` budget influences model performance depending on the task type.
For **Backdoor** tasks, the system benefits from higher `ROAR_qm` budgets, suggesting that these tasks require more "qm" resources to achieve higher accuracy (MRR). Conversely, for **Targeted** tasks, increasing the `ROAR_qm` budget is detrimental to performance, causing a sharp decline in MRR. This suggests that the `ROAR_qm` budget might be introducing noise or over-fitting in the Targeted tasks, or that the resource allocation strategy is fundamentally incompatible with the Targeted task objective. The consistency of this pattern across all sub-tasks (Vulnerability, Mitigation, Diagnosis, Treatment, Freebase, WordNet) indicates this is a systemic behavior of the model or the evaluation framework being tested.