## [3D Surface Plots]: MRR vs. ROAR Budgets for Backdoor and Targeted Attacks
### Overview
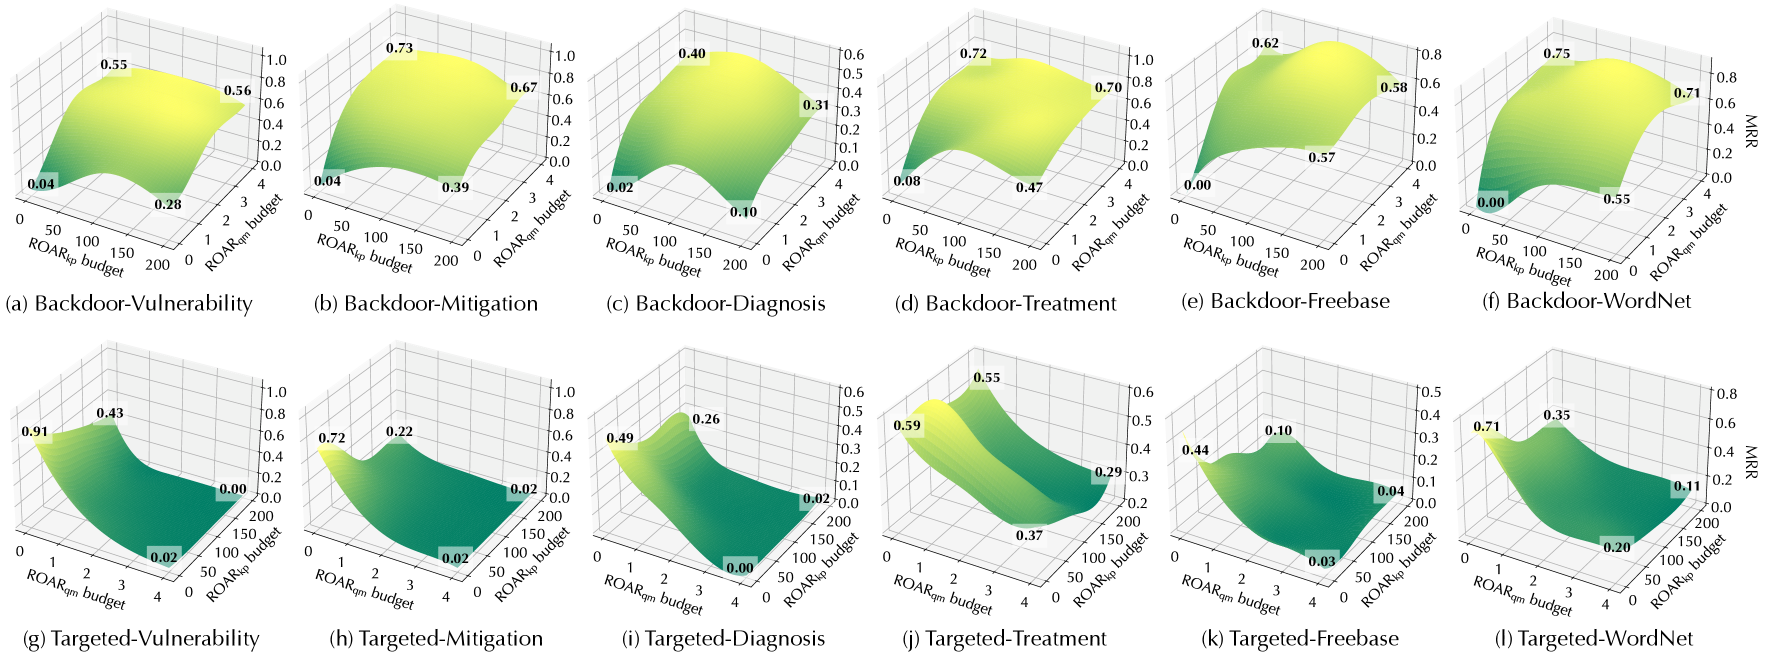
The image contains 12 3D surface plots (arranged in 2 rows × 6 columns) illustrating the **Mean Reciprocal Rank (MRR)** (a ranking performance metric) as a function of two budget parameters:
- **X-axis**: `ROAR_kp budget` (range: 0–200, ticks: 0, 50, 100, 150, 200).
- **Y-axis**: `ROAR_qm budget` (range: 0–4, ticks: 0, 1, 2, 3, 4).
- **Z-axis**: `MRR` (range: 0.0–1.0, or 0.0–0.6 for some plots).
Plots are grouped by attack type (**Backdoor** (top row) vs. **Targeted** (bottom row)) and task (Vulnerability, Mitigation, Diagnosis, Treatment, Freebase, WordNet).
### Components/Axes
- **Axes Labels**:
- X: `ROAR_kp budget` (front axis, 0–200).
- Y: `ROAR_qm budget` (left axis, 0–4).
- Z: `MRR` (vertical axis, 0.0–1.0 or 0.0–0.6).
- **Plot Titles** (row-wise):
- Top (Backdoor): (a) Vulnerability, (b) Mitigation, (c) Diagnosis, (d) Treatment, (e) Freebase, (f) WordNet.
- Bottom (Targeted): (g) Vulnerability, (h) Mitigation, (i) Diagnosis, (j) Treatment, (k) Freebase, (l) WordNet.
- **Surface Labels**: Numerical MRR values (e.g., 0.04, 0.55, 0.73) at specific (ROAR_kp, ROAR_qm) points.
### Detailed Analysis (Per Attack Type)
#### **Top Row: Backdoor Attacks**
Backdoor attacks show MRR increasing with moderate budgets (ROAR_kp ~100, ROAR_qm ~2), then plateauing:
- **(a) Backdoor-Vulnerability**: MRR ~0.55–0.56 at (100, 2); low values (0.04, 0.28) at (0, 0) and (0, 2).
- **(b) Backdoor-Mitigation**: MRR ~0.73–0.67 at (100, 2); low values (0.04, 0.39) at (0, 0) and (0, 2).
- **(c) Backdoor-Diagnosis**: Lower MRR (max ~0.40–0.31) at (100, 2); low values (0.02, 0.10) at (0, 0) and (0, 2).
- **(d) Backdoor-Treatment**: MRR ~0.72–0.70 at (100, 2); low values (0.08, 0.47) at (0, 0) and (0, 2).
- **(e) Backdoor-Freebase**: MRR ~0.62–0.58 at (100, 2); low values (0.00, 0.57) at (0, 0) and (0, 2).
- **(f) Backdoor-WordNet**: MRR ~0.75–0.71 at (100, 2); low values (0.00, 0.55) at (0, 0) and (0, 2).
#### **Bottom Row: Targeted Attacks**
Targeted attacks peak at low ROAR_kp (0) and moderate ROAR_qm (2), then decline with higher ROAR_kp:
- **(g) Targeted-Vulnerability**: MRR ~0.91 at (0, 2); drops to 0.00 at (200, 2).
- **(h) Targeted-Mitigation**: MRR ~0.72 at (0, 2); drops to 0.02 at (200, 2).
- **(i) Targeted-Diagnosis**: MRR ~0.49 at (0, 2); drops to 0.00 at (200, 2).
- **(j) Targeted-Treatment**: MRR ~0.59 at (0, 2); drops to 0.29 at (200, 2).
- **(k) Targeted-Freebase**: MRR ~0.44 at (0, 2); drops to 0.04 at (200, 2).
- **(l) Targeted-WordNet**: MRR ~0.71 at (0, 2); drops to 0.11 at (200, 2).
### Key Observations
1. **Attack Type Differences**:
- Backdoor attacks perform best with *moderate* budgets (ROAR_kp ~100, ROAR_qm ~2).
- Targeted attacks perform best with *low* ROAR_kp (0) and *moderate* ROAR_qm (2), then decline with higher ROAR_kp.
2. **Task Variability**:
- Diagnosis tasks (Backdoor-Diagnosis, Targeted-Diagnosis) have the lowest MRR, suggesting resistance to attacks.
- WordNet and Vulnerability tasks have the highest MRR, indicating greater vulnerability/effectiveness of attacks.
### Interpretation
The plots reveal how budget allocation (ROAR_kp, ROAR_qm) impacts attack effectiveness (MRR) across tasks:
- **Backdoor Attacks**: Balanced budgets (moderate kp/qm) enhance effectiveness, likely due to distributed resource allocation.
- **Targeted Attacks**: Focused budgets (low kp, moderate qm) maximize effectiveness, as resources are concentrated on key targets.
- **Security Implications**: Diagnosis tasks are more robust to attacks, while WordNet/Vulnerability tasks require stronger defenses. Budget optimization (e.g., limiting kp for targeted attacks) can mitigate risks.
This analysis helps inform security strategies (e.g., hardening vulnerable tasks, optimizing attack budgets) by quantifying how resource allocation impacts attack performance.