## Heatmap: Correlation Coefficients Between Models and Datasets
### Overview
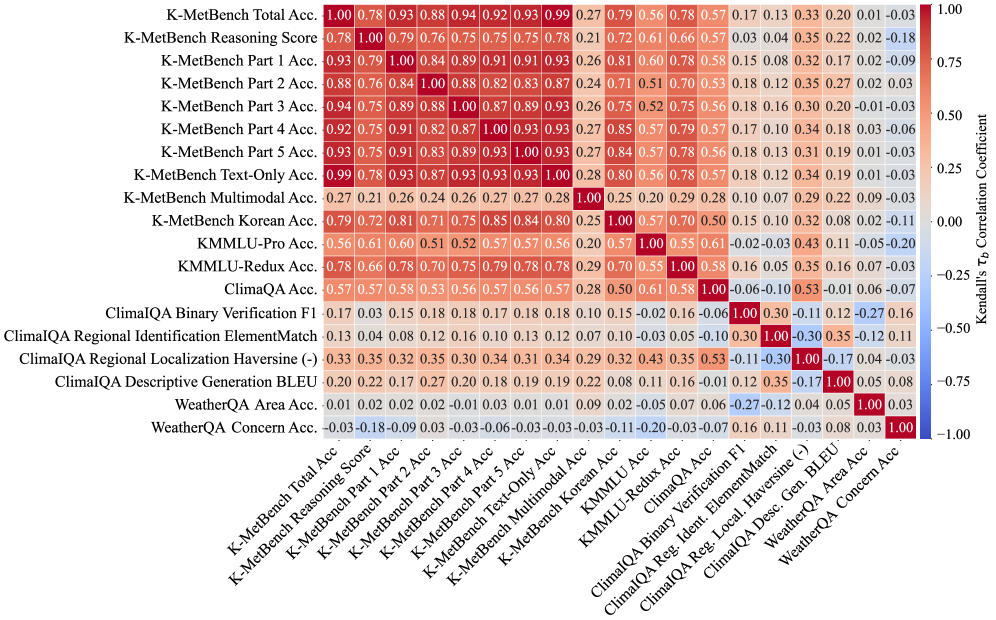
This heatmap visualizes Kendall’s τb correlation coefficients between various AI models (rows) and datasets (columns). Values range from -1.00 (strong negative correlation) to 1.00 (strong positive correlation), with red indicating positive and blue indicating negative correlations. The diagonal shows perfect self-correlations (1.00), while off-diagonal cells reveal relationships between different models/datasets.
### Components/Axes
- **X-axis**: Datasets/Models (e.g., K-MetBench Total Acc., K-MetBench Reasoning Score, ClimaIQA Binary Verification F1, etc.)
- **Y-axis**: Models/Datasets (same labels as X-axis)
- **Legend**: Color gradient from blue (-1.00) to red (1.00), with numerical labels at intervals (-0.75, -0.50, -0.25, 0.00, 0.25, 0.50, 0.75, 1.00)
- **Placement**: Legend is positioned on the right side of the heatmap.
### Detailed Analysis
1. **K-MetBench Series**:
- **Total Acc.** (1.00) correlates strongly with its subcomponents (Part 1: 0.93, Part 2: 0.88, etc.), indicating internal consistency.
- **Text-Only Acc.** (0.99) shows high correlation with multimodal versions (0.88–0.93), suggesting shared features.
- **Korean Acc.** (0.81) has moderate correlation with other parts (0.71–0.85), reflecting language-specific nuances.
2. **KMMMLU-Pro Acc.**:
- Perfect self-correlation (1.00) and strong ties to Redux Acc. (0.61), indicating similar evaluation metrics.
3. **ClimaIQA Metrics**:
- **Binary Verification F1** (-0.60 with K-MetBench Total Acc.) shows a strong negative correlation, suggesting divergent performance drivers.
- **Regional Localization Haversine** (-0.33 to -0.35) correlates negatively with most models, highlighting unique evaluation criteria.
4. **WeatherQA**:
- **Area Acc.** (0.02–0.07) and **Concern Acc.** (-0.03 to -0.11) show weak/no correlation with most models, indicating distinct evaluation frameworks.
### Key Observations
- **High Intra-Model Consistency**: Subcomponents of the same model (e.g., K-MetBench Parts) exhibit strong correlations (0.75–1.00).
- **Negative Cross-Model Relationships**: ClimaIQA metrics often show negative correlations with K-MetBench and KMMMLU-Pro, suggesting conflicting evaluation priorities.
- **Language-Specific Variance**: K-MetBench Korean Acc. has lower correlations (0.51–0.81) compared to English versions, reflecting linguistic differences.
- **Outliers**:
- ClimaIQA Regional Identification ElementMatch (0.35) has moderate positive correlation with K-MetBench Part 5 Acc. (0.93), an anomaly given general trends.
- WeatherQA Concern Acc. (-0.11 to -0.27) shows unexpected negative correlations with ClimaIQA metrics.
### Interpretation
The heatmap reveals that models with overlapping evaluation criteria (e.g., K-MetBench subcomponents) exhibit strong positive correlations, while models targeting distinct tasks (e.g., ClimaIQA vs. WeatherQA) show weaker or negative relationships. The negative correlations between ClimaIQA and K-MetBench suggest that regional localization and multimodal reasoning may conflict in evaluation frameworks. The weak WeatherQA correlations imply it measures unique aspects of climate communication not captured by other models. The KMMMLU-Pro/Redux pairing highlights the importance of standardized evaluation benchmarks in AI research.