## Bar Chart: Performance Comparison (Latency in ms)
### Overview
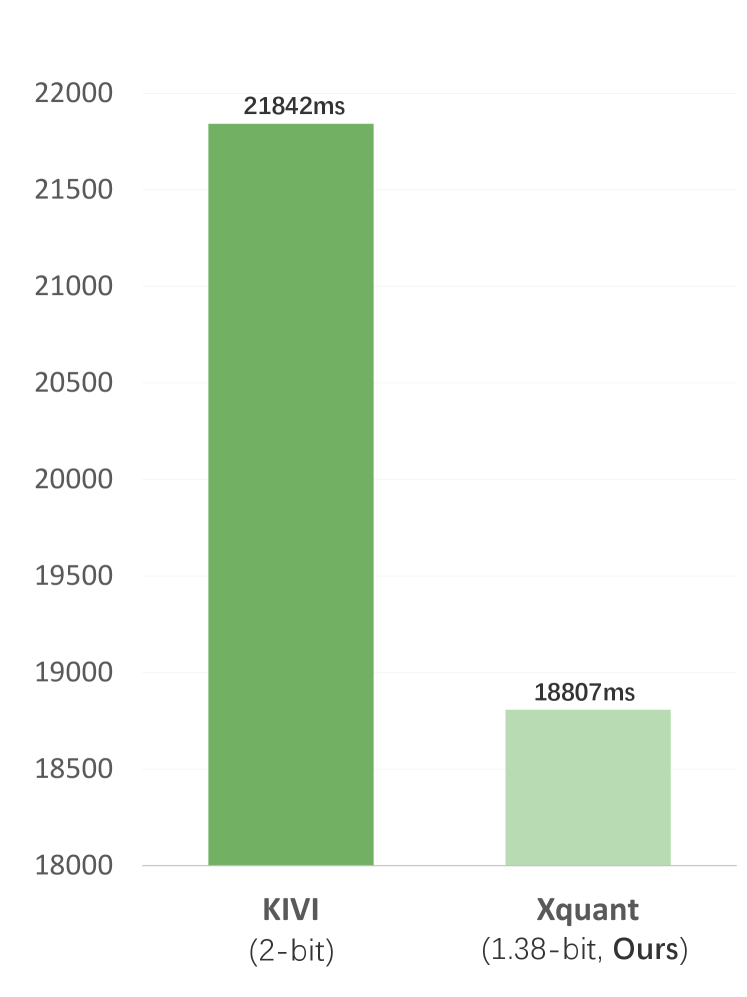
The image is a vertical bar chart comparing the latency (measured in milliseconds) of two distinct quantization methods: "KIVI" and "Xquant". The chart demonstrates that the "Xquant" method, labeled as "Ours," achieves a lower latency compared to the "KIVI" method.
### Components/Axes
* **Y-Axis (Vertical):** Represents time in milliseconds (ms). The scale ranges from 18000ms at the bottom to 22000ms at the top, with grid lines marked at 500ms intervals (18000, 18500, 19000, 19500, 20000, 20500, 21000, 21500, 22000).
* **X-Axis (Horizontal):** Categorical labels for the two methods being compared.
* **Left Category:** "KIVI (2-bit)"
* **Right Category:** "Xquant (1.38-bit, Ours)"
* **Data Series:**
* **KIVI (2-bit):** Represented by a dark green bar.
* **Xquant (1.38-bit, Ours):** Represented by a light green bar.
### Detailed Analysis
* **KIVI (2-bit):**
* **Position:** Left side of the chart.
* **Visual Trend:** The bar is the tallest in the chart, extending nearly to the 22000ms mark.
* **Value:** 21842ms.
* **Xquant (1.38-bit, Ours):**
* **Position:** Right side of the chart.
* **Visual Trend:** The bar is significantly shorter than the KIVI bar, extending just above the 18500ms mark.
* **Value:** 18807ms.
### Key Observations
* **Performance Delta:** The "Xquant" method is faster than the "KIVI" method. The difference in latency is approximately 3035ms (21842ms - 18807ms).
* **Efficiency:** The "Xquant" method achieves this lower latency while utilizing a lower bit-width (1.38-bit) compared to the KIVI method (2-bit).
* **Visual Hierarchy:** The chart uses color to distinguish the methods, with the "Ours" method (Xquant) using a lighter shade of green, perhaps to denote a newer or different approach.
### Interpretation
This chart is a performance benchmark likely derived from a research paper regarding Large Language Model (LLM) inference acceleration or quantization techniques.
The data suggests a "Pareto improvement" for the "Xquant" method: it is both more compressed (1.38-bit vs 2-bit) and faster (lower latency) than the KIVI baseline. In the context of technical research, this is a strong result, as it demonstrates that the authors' method ("Ours") provides both better memory efficiency (via lower bit-width) and better computational speed (via lower latency) compared to the existing KIVI standard. The chart is designed to visually validate the superiority of the Xquant approach.