## Bar Chart: Performance Comparison of KIVI (2-bit) and Xquant (1.38-bit)
### Overview
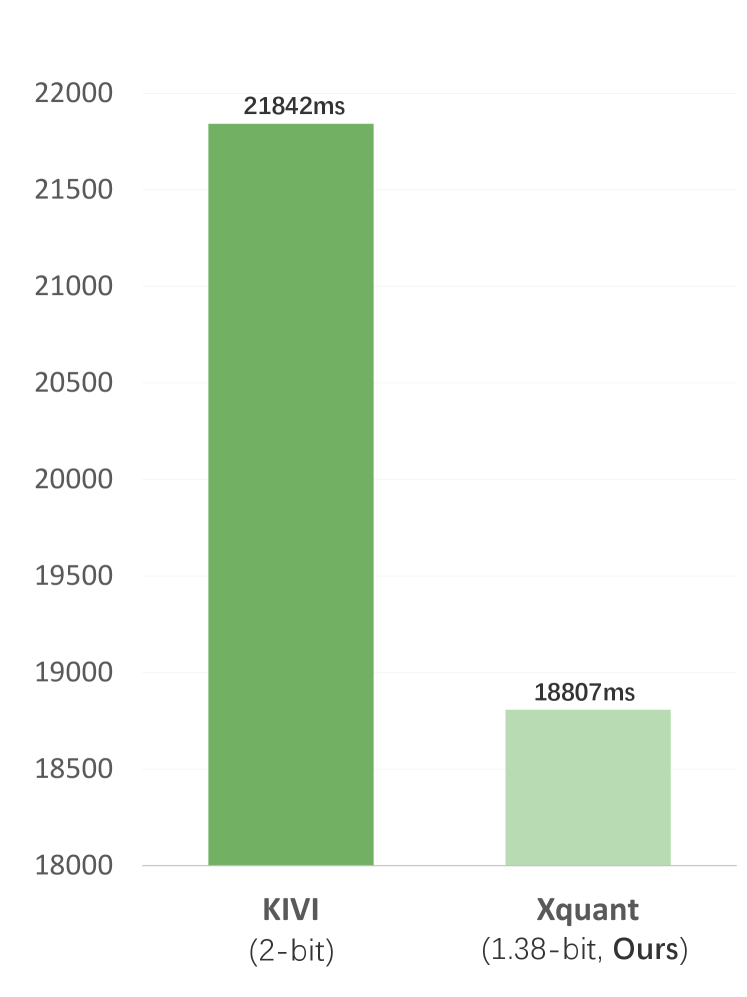
The chart compares the performance of two technologies, KIVI (2-bit) and Xquant (1.38-bit, labeled as "Ours"), using a vertical bar chart. The y-axis represents time in milliseconds (ms), while the x-axis lists the two technologies. The chart emphasizes a significant performance difference between the two.
### Components/Axes
- **X-axis**:
- Categories: "KIVI (2-bit)" and "Xquant (1.38-bit, Ours)".
- Positioning: Centered labels below each bar.
- **Y-axis**:
- Scale: Linear, ranging from 18,000 ms (bottom) to 22,000 ms (top), with increments of 500 ms.
- Labels: Numerical values (e.g., 18,000, 18,500, ..., 22,000) aligned to the left of the axis.
- **Legend**:
- Located at the bottom of the chart.
- Colors:
- Dark green for "KIVI (2-bit)".
- Light green for "Xquant (1.38-bit, Ours)".
- **Bars**:
- Two vertical bars, one for each technology.
- Heights correspond to their respective performance values.
### Detailed Analysis
- **KIVI (2-bit)**:
- Bar height: 21,842 ms.
- Position: Leftmost bar, dark green.
- **Xquant (1.38-bit, Ours)**:
- Bar height: 18,807 ms.
- Position: Rightmost bar, light green.
- **Y-axis Alignment**:
- The KIVI bar extends to ~21,842 ms, nearly reaching the top of the chart.
- The Xquant bar aligns closer to the 18,800 ms mark, significantly lower than KIVI.
### Key Observations
1. **Performance Gap**: Xquant (1.38-bit) outperforms KIVI (2-bit) by **3,035 ms** (21,842 ms vs. 18,807 ms).
2. **Color Coding**: The legend clearly distinguishes the two technologies via dark and light green.
3. **Axis Scaling**: The y-axis starts at 18,000 ms, ensuring both bars are visible above the baseline.
### Interpretation
The data suggests that the 1.38-bit Xquant technology is **~13% faster** than the 2-bit KIVI, as measured by the time metric (lower ms = better performance). The use of "Ours" implies Xquant is the proprietary or preferred solution of the creators. The stark difference in performance could indicate that reducing bit precision (from 2-bit to 1.38-bit) improves efficiency without compromising functionality. This aligns with trends in computational optimization, where lower precision often enhances speed. The chart’s design effectively highlights this trade-off, making it suitable for technical audiences evaluating algorithmic or hardware performance.