# Technical Document Extraction: Graphs (e) and (f)
## Graph (e)
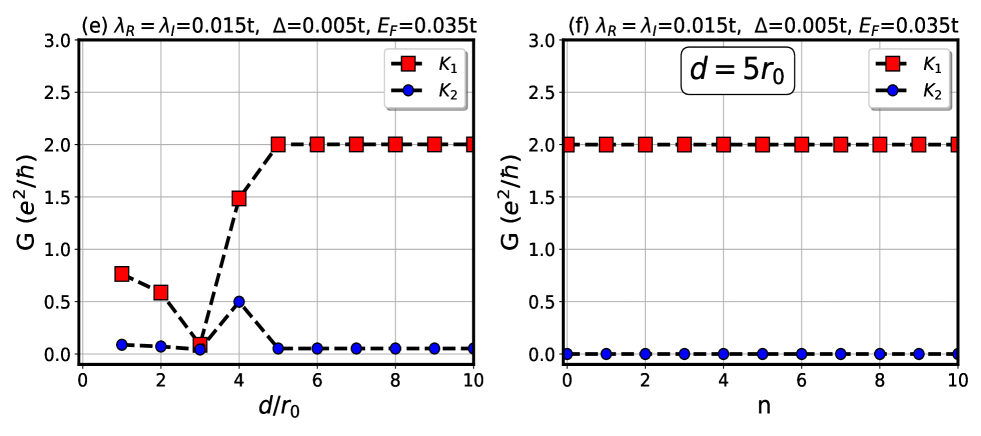
- **Axes**:
- **x-axis**: `d/r₀` (dimensionless ratio of distance to reference length `r₀`)
- **y-axis**: `G (e²/ħ)` (conductance normalized by quantum of conductance)
- **Legend**:
- `K₁` (red squares)
- `K₂` (blue circles)
- **Key Trends**:
- **K₁**:
- Starts at ~0.75 at `d/r₀ = 0`
- Drops to ~0.25 at `d/r₀ = 2`
- Rises sharply to ~2.0 at `d/r₀ = 4`
- Remains constant at ~2.0 for `d/r₀ ≥ 4`
- **K₂**:
- Starts at ~0.1 at `d/r₀ = 0`
- Peaks at ~0.5 at `d/r₀ = 4`
- Drops to near-zero for `d/r₀ ≥ 4`
- **Parameters**:
- `λ_R = λ_I = 0.015t`
- `Δ = 0.005t`
- `E_F = 0.035t`
## Graph (f)
- **Axes**:
- **x-axis**: `n` (integer index, 0–10)
- **y-axis**: `G (e²/ħ)` (same as graph (e))
- **Legend**:
- `K₁` (red squares)
- `K₂` (blue circles)
- **Key Trends**:
- **K₁**:
- Constant at ~2.0 for all `n`
- **K₂**:
- Constant at ~0.0 for all `n`
- **Embedded Text**:
- Box annotation: `d = 5r₀` (indicates fixed distance in graph (f))
## Cross-Reference Legend Consistency
- **Graph (e)**:
- Red squares (`K₁`) match red square markers in the plot.
- Blue circles (`K₂`) match blue circle markers in the plot.
- **Graph (f)**:
- Red squares (`K₁`) match red square markers in the plot.
- Blue circles (`K₂`) match blue circle markers in the plot.
## Observations
1. **Graph (e)** shows conductance `G` as a function of normalized distance `d/r₀`, with `K₁` and `K₂` exhibiting distinct behaviors (step-like increase for `K₁`, transient peak for `K₂`).
2. **Graph (f)** isolates the behavior at a fixed distance `d = 5r₀`, where `K₁` dominates (`G ≈ 2.0`) and `K₂` vanishes (`G ≈ 0.0`).
3. Parameters (`λ_R`, `λ_I`, `Δ`, `E_F`) are identical for both graphs, suggesting they describe the same system under varying spatial conditions.