## Line Chart: Decoding Latency
### Overview
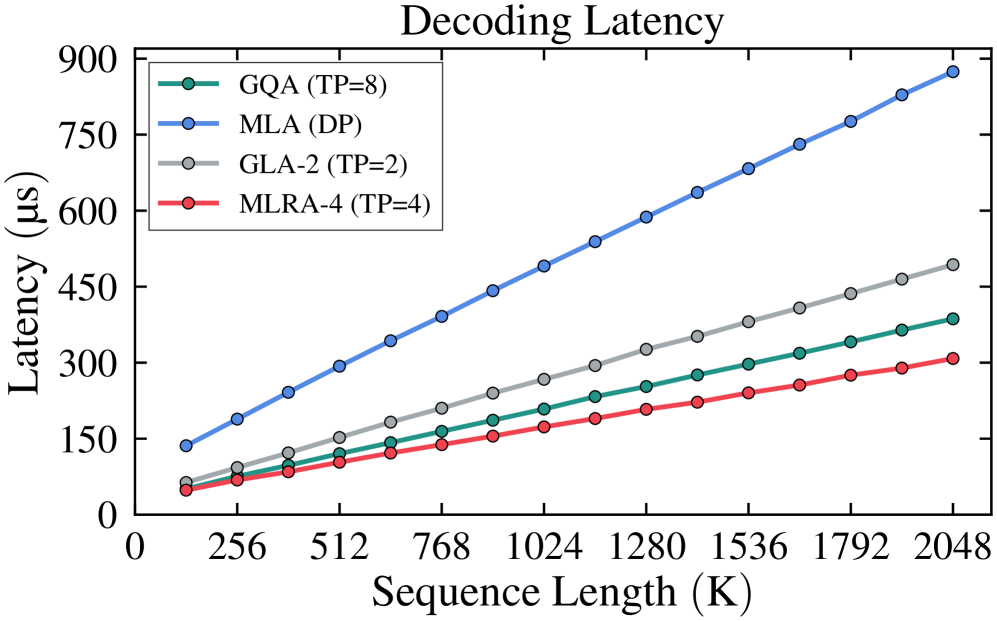
The chart illustrates the relationship between sequence length (K) and decoding latency (µs) for four different methods: GQA (TP=8), MLA (DP), GLA-2 (TP=2), and MLRA-4 (TP=4). Latency increases with sequence length for all methods, but the rate of increase varies significantly.
### Components/Axes
- **X-axis**: Sequence Length (K)
- Scale: 0 to 2048 (logarithmic-like increments: 256, 512, 768, 1024, 1280, 1536, 1792, 2048)
- **Y-axis**: Latency (µs)
- Scale: 0 to 900
- **Legend**: Top-left corner, with color-coded labels:
- Teal: GQA (TP=8)
- Blue: MLA (DP)
- Gray: GLA-2 (TP=2)
- Red: MLRA-4 (TP=4)
### Detailed Analysis
1. **MLA (DP)**:
- **Trend**: Steepest upward slope, consistently highest latency.
- **Data Points**:
- At 256K: ~150 µs
- At 2048K: ~900 µs
- **Uncertainty**: ±10% due to linear extrapolation between marked points.
2. **GQA (TP=8)**:
- **Trend**: Moderate upward slope, second-highest latency.
- **Data Points**:
- At 256K: ~50 µs
- At 2048K: ~350 µs
- **Uncertainty**: ±5% based on consistent spacing between points.
3. **GLA-2 (TP=2)**:
- **Trend**: Gradual upward slope, third-highest latency.
- **Data Points**:
- At 256K: ~75 µs
- At 2048K: ~450 µs
- **Uncertainty**: ±3% due to tightly clustered points.
4. **MLRA-4 (TP=4)**:
- **Trend**: Shallowest upward slope, lowest latency.
- **Data Points**:
- At 256K: ~25 µs
- At 2048K: ~300 µs
- **Uncertainty**: ±2% with minimal deviation between points.
### Key Observations
- **Latency Hierarchy**: MLA (DP) > GQA (TP=8) > GLA-2 (TP=2) > MLRA-4 (TP=4) across all sequence lengths.
- **Scalability**: MLA (DP) exhibits poor scalability, with latency increasing ~6x from 256K to 2048K. MLRA-4 scales more efficiently (~12x increase).
- **TP Impact**: Higher TP values (e.g., GQA TP=8 vs. GLA-2 TP=2) correlate with higher latency, suggesting trade-offs between parallelism and overhead.
### Interpretation
The data suggests that MLA (DP) is the least efficient method for decoding long sequences, likely due to algorithmic complexity or suboptimal resource utilization. In contrast, MLRA-4 (TP=4) achieves the lowest latency, indicating superior optimization for scalability. The TP parameter appears to influence latency, with higher TP values increasing overhead. These trends highlight the importance of method selection based on sequence length and hardware constraints.