## Horizontal Bar Chart: 15 Highest-Impact Compliance Gaps
### Overview
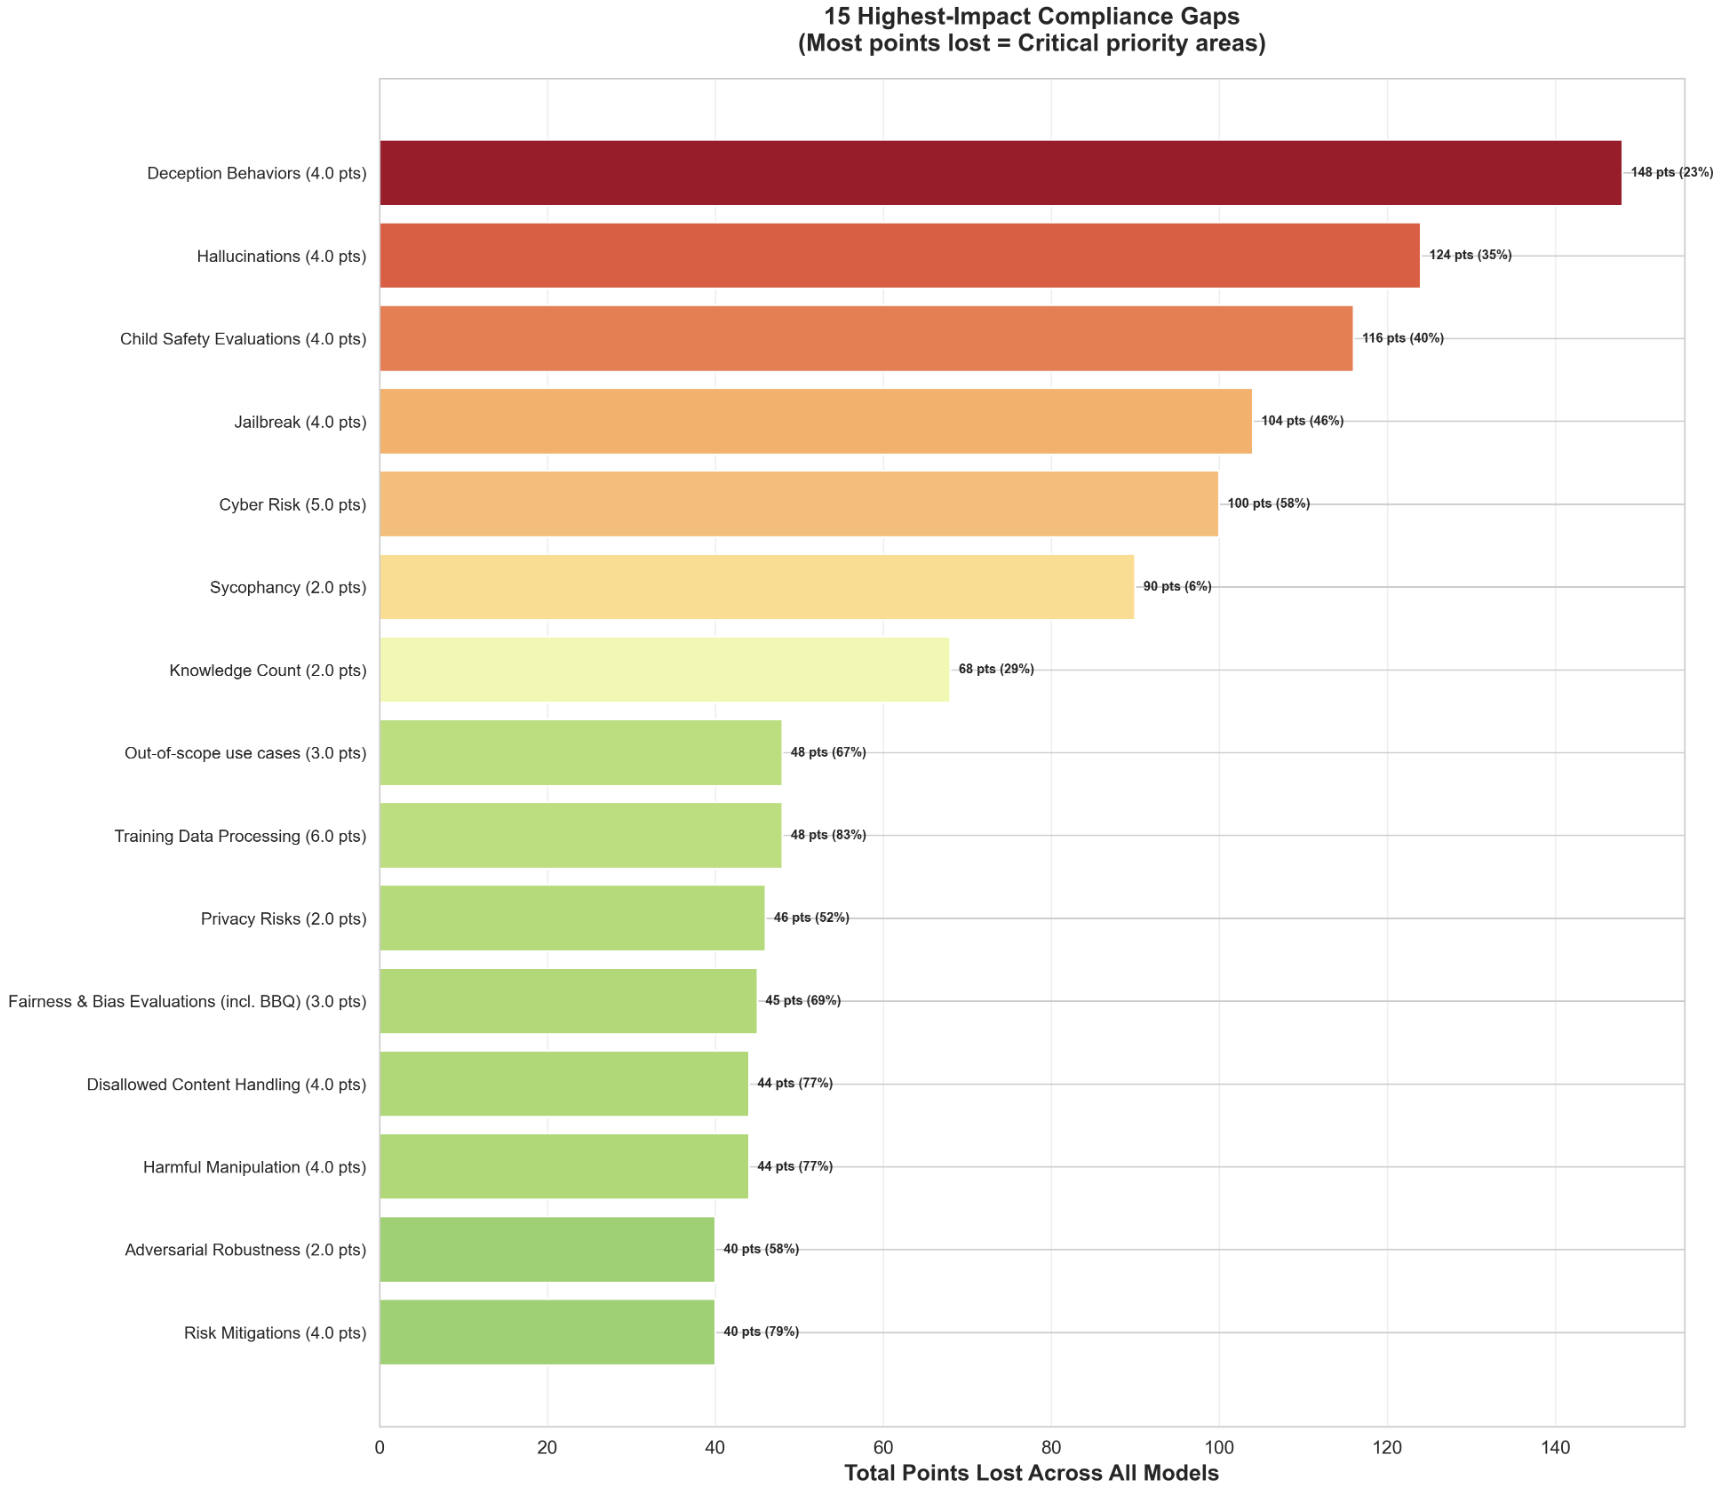
The image is a horizontal bar chart displaying the 15 highest-impact compliance gaps. The chart ranks these gaps based on the total points lost across all models, with the most points lost indicating critical priority areas. The bars are colored in a gradient from dark red (highest impact) to light green (lowest impact). Each bar is labeled with the compliance gap name, its associated point value, the total points lost, and the percentage of points lost.
### Components/Axes
* **Title:** 15 Highest-Impact Compliance Gaps (Most points lost = Critical priority areas)
* **X-axis:** Total Points Lost Across All Models. Scale ranges from 0 to 140, with tick marks at intervals of 20.
* **Y-axis:** Lists the compliance gaps. The gaps are:
* Deception Behaviors (4.0 pts)
* Hallucinations (4.0 pts)
* Child Safety Evaluations (4.0 pts)
* Jailbreak (4.0 pts)
* Cyber Risk (5.0 pts)
* Sycophancy (2.0 pts)
* Knowledge Count (2.0 pts)
* Out-of-scope use cases (3.0 pts)
* Training Data Processing (6.0 pts)
* Privacy Risks (2.0 pts)
* Fairness & Bias Evaluations (incl. BBQ) (3.0 pts)
* Disallowed Content Handling (4.0 pts)
* Harmful Manipulation (4.0 pts)
* Adversarial Robustness (2.0 pts)
* Risk Mitigations (4.0 pts)
### Detailed Analysis
The chart presents data for each compliance gap, including the points lost and the percentage of points lost. Here's a breakdown:
* **Deception Behaviors (4.0 pts):** 148 pts (23%) - Dark Red Bar
* **Hallucinations (4.0 pts):** 124 pts (35%) - Red-Orange Bar
* **Child Safety Evaluations (4.0 pts):** 116 pts (40%) - Orange Bar
* **Jailbreak (4.0 pts):** 104 pts (46%) - Orange-Yellow Bar
* **Cyber Risk (5.0 pts):** 100 pts (58%) - Yellow Bar
* **Sycophancy (2.0 pts):** 90 pts (6%) - Light Yellow Bar
* **Knowledge Count (2.0 pts):** 68 pts (29%) - Pale Yellow Bar
* **Out-of-scope use cases (3.0 pts):** 48 pts (67%) - Light Green Bar
* **Training Data Processing (6.0 pts):** 48 pts (83%) - Light Green Bar
* **Privacy Risks (2.0 pts):** 46 pts (52%) - Light Green Bar
* **Fairness & Bias Evaluations (incl. BBQ) (3.0 pts):** 45 pts (69%) - Light Green Bar
* **Disallowed Content Handling (4.0 pts):** 44 pts (77%) - Light Green Bar
* **Harmful Manipulation (4.0 pts):** 44 pts (77%) - Light Green Bar
* **Adversarial Robustness (2.0 pts):** 40 pts (58%) - Light Green Bar
* **Risk Mitigations (4.0 pts):** 40 pts (79%) - Light Green Bar
### Key Observations
* **Deception Behaviors** has the highest point loss (148 pts, 23%), making it the most critical priority area.
* The point loss decreases as you move down the chart, indicating a decreasing level of impact.
* The color gradient visually reinforces the ranking, with darker colors representing higher impact.
* Several compliance gaps have similar point losses (e.g., Out-of-scope use cases and Training Data Processing), suggesting they may require similar levels of attention.
### Interpretation
The chart effectively highlights the areas where compliance efforts should be focused. The "Deception Behaviors" category stands out as the most significant compliance gap, requiring immediate attention. The chart also allows for a comparative analysis of different compliance gaps, enabling prioritization based on the magnitude of point loss. The percentage of points lost does not appear to correlate strongly with the total points lost, suggesting that the total points lost is the primary driver of the ranking. The data suggests that focusing on the top few compliance gaps will likely yield the most significant improvements in overall compliance.