## Bar Chart: 15 Highest-Impact Compliance Gaps
### Overview
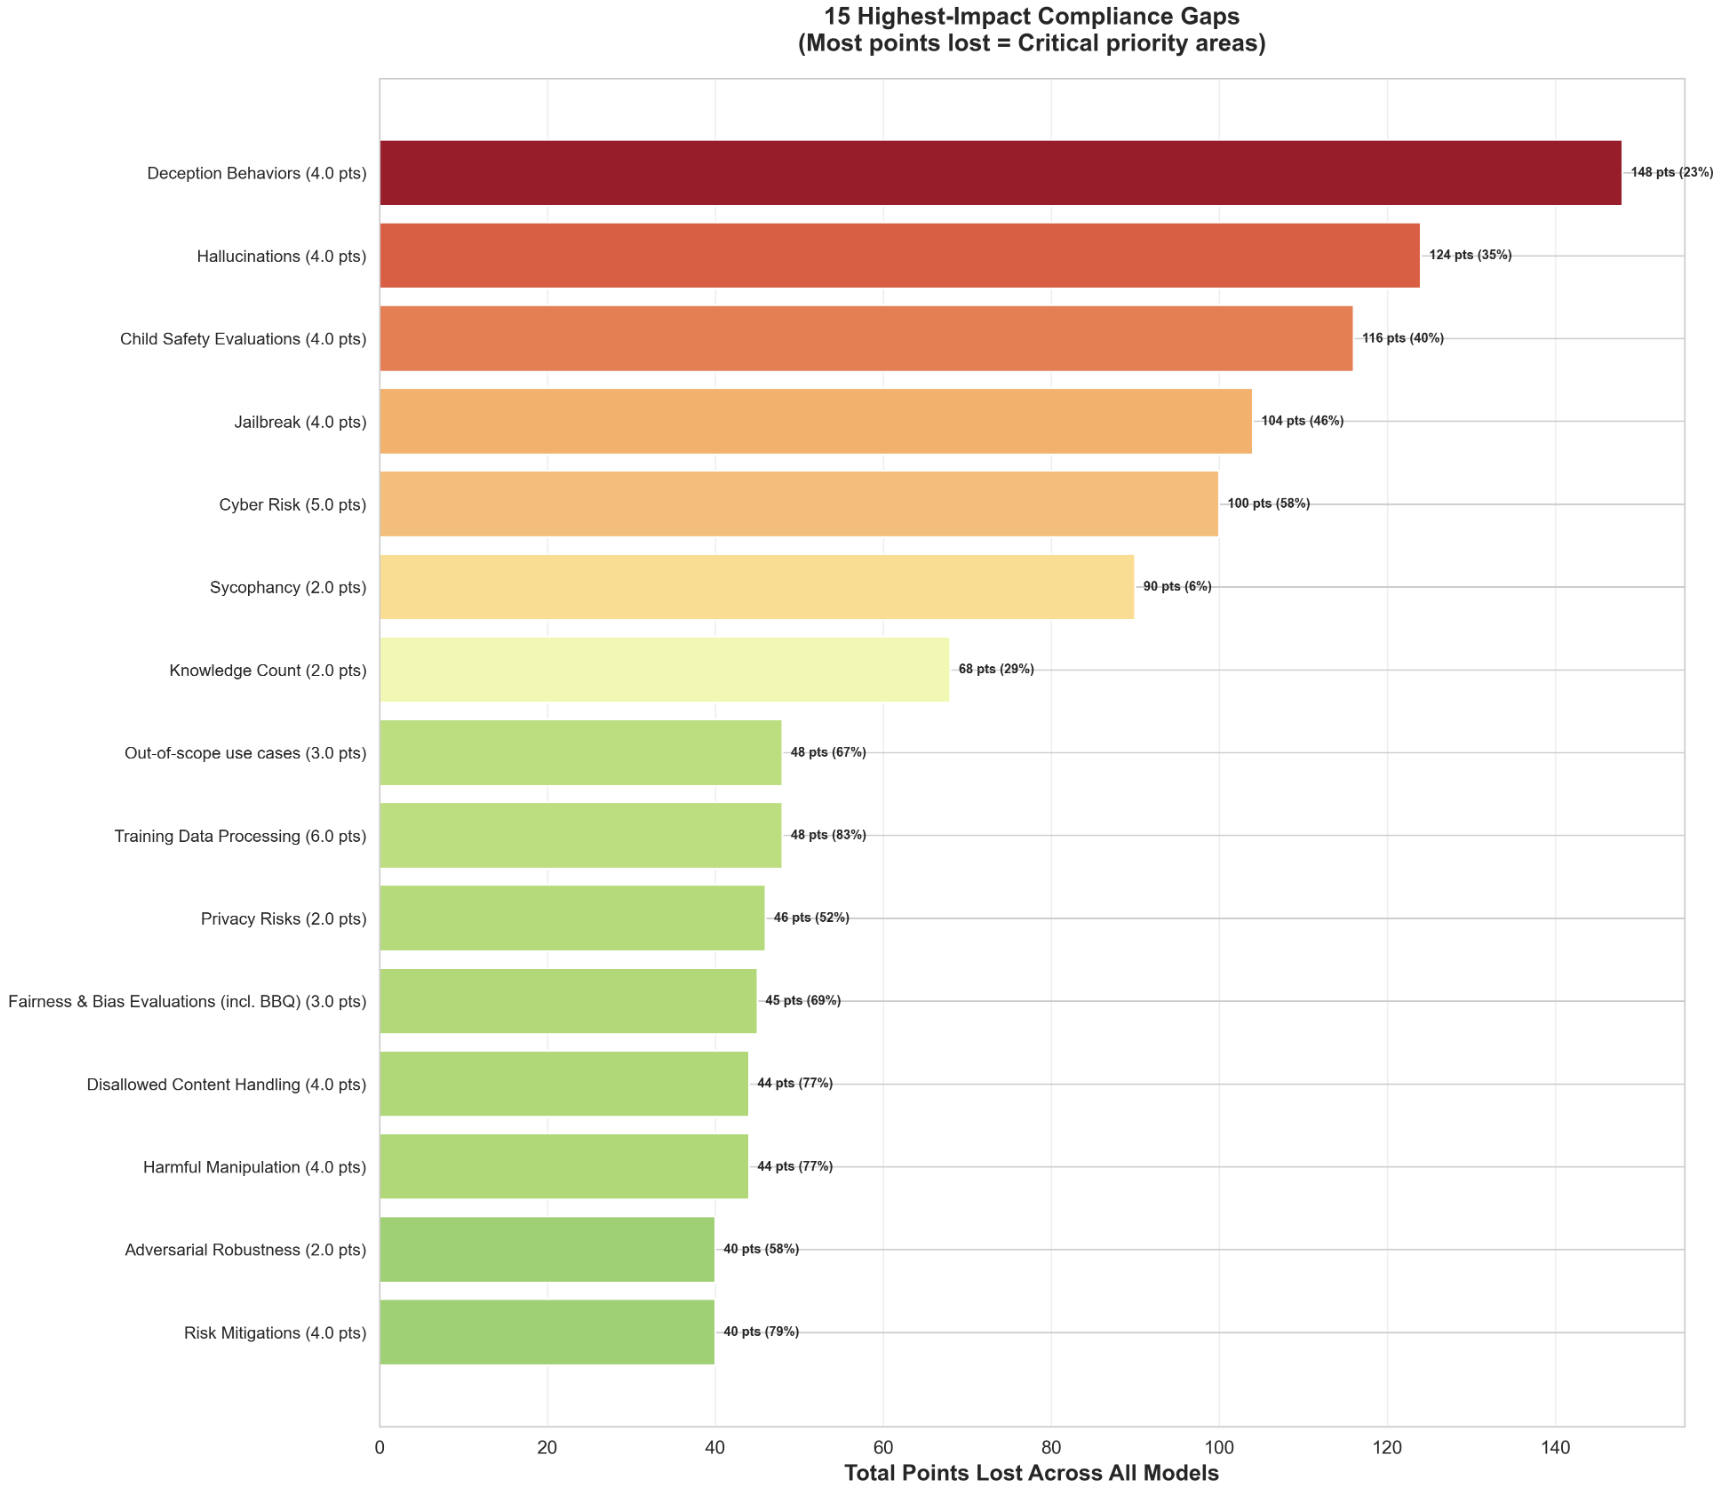
This horizontal bar chart visualizes the 15 highest-impact compliance gaps across AI models, ranked by total points lost. The x-axis represents "Total Points Lost Across All Models," while the y-axis lists compliance gaps with associated point values and severity percentages. Colors transition from dark red (highest severity) to green (lowest severity).
### Components/Axes
- **X-Axis**: "Total Points Lost Across All Models" (linear scale, 0–160).
- **Y-Axis**: 15 compliance gaps, ordered by points lost (highest to lowest).
- **Legend**: Implicit color gradient (dark red = critical, green = lower priority).
### Detailed Analysis
1. **Highest Severity (Dark Red/Orange)**:
- **Deception Behaviors (4.0 pts)**: 148 pts (23%)
- **Hallucinations (4.0 pts)**: 124 pts (35%)
- **Child Safety Evaluations (4.0 pts)**: 116 pts (40%)
- **Jailbreak (4.0 pts)**: 104 pts (46%)
- **Cyber Risk (5.0 pts)**: 100 pts (58%)
2. **Mid-Range Severity (Yellow/Green)**:
- **Sycophancy (2.0 pts)**: 90 pts (6%)
- **Knowledge Count (2.0 pts)**: 68 pts (29%)
- **Out-of-scope use cases (3.0 pts)**: 48 pts (67%)
- **Training Data Processing (6.0 pts)**: 48 pts (83%)
- **Privacy Risks (2.0 pts)**: 46 pts (52%)
- **Fairness & Bias Evaluations (incl. BBQ) (3.0 pts)**: 45 pts (69%)
3. **Lower Severity (Light Green)**:
- **Disallowed Content Handling (4.0 pts)**: 44 pts (77%)
- **Harmful Manipulation (4.0 pts)**: 44 pts (77%)
- **Adversarial Robustness (2.0 pts)**: 40 pts (58%)
- **Risk Mitigations (4.0 pts)**: 40 pts (79%)
### Key Observations
- **Deception Behaviors** is the most critical gap, losing the most points (148) despite a relatively low point value (4.0).
- **Cyber Risk** (5.0 pts) has the highest percentage of total points lost (58%), indicating disproportionate impact relative to its point value.
- **Training Data Processing** (6.0 pts) and **Out-of-scope use cases** (3.0 pts) show high percentages (83% and 67%, respectively), suggesting systemic issues in data handling.
- **Risk Mitigations** and **Adversarial Robustness** (both 40 pts) are the least severe but still represent notable gaps.
### Interpretation
The chart reveals that **higher point-value gaps** (e.g., Cyber Risk at 5.0 pts) often correlate with **higher percentages of total points lost**, highlighting their outsized impact. Conversely, gaps like **Training Data Processing** (6.0 pts) and **Out-of-scope use cases** (3.0 pts) demonstrate that even lower-point categories can represent significant systemic failures. The color gradient underscores prioritization: dark red/orange gaps require immediate attention, while green gaps may warrant long-term monitoring. The data suggests compliance frameworks should focus on high-impact, high-severity areas first, while addressing lower-severity gaps through iterative improvements.