## Line Charts: Accuracy vs. Token Count and Deep-Thinking Ratio
### Overview
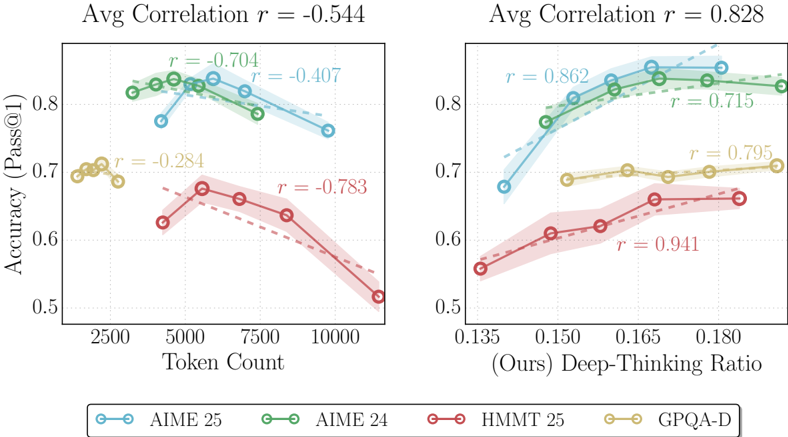
The image presents two line charts comparing the accuracy (Pass@1) of different models against two different parameters: Token Count (left chart) and Deep-Thinking Ratio (right chart). Each chart displays data for four models: AIME 25, AIME 24, HMMT 25, and GPQA-D. The charts also include correlation coefficients (r-values) indicating the strength and direction of the linear relationship between the accuracy and the respective parameter. Shaded regions around each line represent the confidence interval.
### Components/Axes
**Left Chart:**
* **Title:** Avg Correlation r = -0.544
* **X-axis:** Token Count, with markers at approximately 2500, 5000, 7500, and 10000.
* **Y-axis:** Accuracy (Pass@1), with markers at 0.5, 0.6, 0.7, and 0.8.
* **Models (Legend):**
* Blue: AIME 25
* Green: AIME 24
* Red: HMMT 25
* Yellow: GPQA-D
**Right Chart:**
* **Title:** Avg Correlation r = 0.828
* **X-axis:** (Ours) Deep-Thinking Ratio, with markers at approximately 0.135, 0.150, 0.165, and 0.180.
* **Y-axis:** Accuracy (Pass@1), with markers at 0.5, 0.6, 0.7, and 0.8.
* **Models (Legend):**
* Blue: AIME 25
* Green: AIME 24
* Red: HMMT 25
* Yellow: GPQA-D
### Detailed Analysis
**Left Chart (Accuracy vs. Token Count):**
* **AIME 25 (Blue):** Starts at approximately (2500, 0.78), increases to (5000, 0.83), then decreases to (10000, 0.78). Correlation r = -0.704 (between 5000 and 10000).
* **AIME 24 (Green):** Starts at approximately (2500, 0.82), increases slightly to (5000, 0.84), then decreases to (10000, 0.79). Correlation r = -0.407 (between 5000 and 10000).
* **HMMT 25 (Red):** Starts at approximately (5000, 0.62), increases to (7500, 0.66), then decreases to (10000, 0.57). Correlation r = -0.783 (between 5000 and 10000).
* **GPQA-D (Yellow):** Relatively constant accuracy around 0.7 between token counts of 2500 and 5000. Correlation r = -0.284 (between 2500 and 5000).
**Right Chart (Accuracy vs. Deep-Thinking Ratio):**
* **AIME 25 (Blue):** Starts at approximately (0.135, 0.68), increases to (0.165, 0.84), then plateaus around 0.84. Correlation r = 0.862 (between 0.135 and 0.165).
* **AIME 24 (Green):** Starts at approximately (0.135, 0.56), increases to (0.165, 0.85), then plateaus around 0.85. Correlation r = 0.715 (between 0.165 and 0.180).
* **HMMT 25 (Red):** Starts at approximately (0.135, 0.55), increases to (0.180, 0.67). Correlation r = 0.941 (between 0.135 and 0.180).
* **GPQA-D (Yellow):** Relatively constant accuracy around 0.7 between Deep-Thinking Ratios of 0.135 and 0.180. Correlation r = 0.795 (between 0.165 and 0.180).
### Key Observations
* In the left chart, AIME 25 and AIME 24 show a negative correlation between token count and accuracy after a certain point (5000 tokens). HMMT 25 also shows a negative correlation. GPQA-D shows a slight negative correlation.
* In the right chart, all models show a positive correlation between Deep-Thinking Ratio and accuracy. HMMT 25 has the strongest positive correlation.
* The average correlation for the left chart is negative (-0.544), while the average correlation for the right chart is positive (0.828).
### Interpretation
The data suggests that increasing the token count beyond a certain threshold may negatively impact the accuracy of the AIME 25, AIME 24, and HMMT 25 models. In contrast, increasing the Deep-Thinking Ratio consistently improves the accuracy of all models tested. The higher average correlation in the right chart indicates that the Deep-Thinking Ratio is a more influential factor in determining the accuracy of these models compared to the token count. The negative correlation between token count and accuracy for some models could be due to overfitting or the introduction of noise with longer sequences.