\n
## Chart: Accuracy vs. Token Count & Deep-Thinking Ratio
### Overview
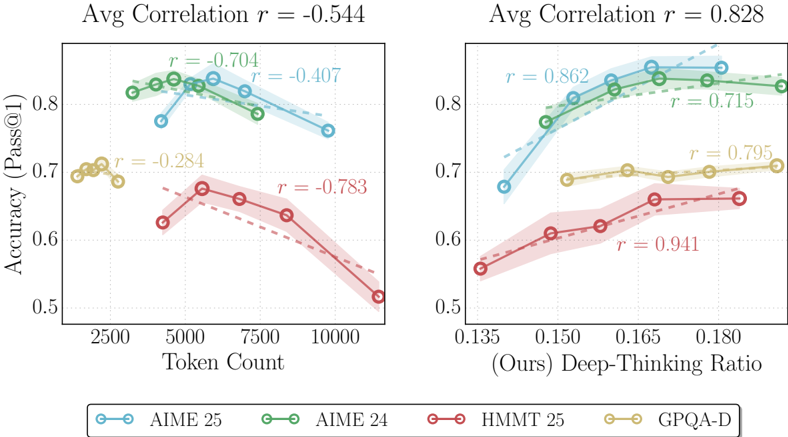
The image presents two line charts comparing the accuracy of different models (AIME 25, AIME 24, HMMT 25, and GPQA-D) under varying conditions. The left chart shows accuracy as a function of token count, while the right chart shows accuracy as a function of a "Deep-Thinking Ratio". Each chart includes shaded areas representing confidence intervals. Both charts display the average correlation coefficient (r) at the top.
### Components/Axes
* **Y-axis (Both Charts):** Accuracy (Pass@1), ranging from approximately 0.5 to 0.9.
* **X-axis (Left Chart):** Token Count, ranging from approximately 2500 to 10000.
* **X-axis (Right Chart):** Deep-Thinking Ratio (labeled "(Ours)"), ranging from approximately 0.135 to 0.180.
* **Legend (Bottom Center):**
* AIME 25 (Light Blue) - Dashed Line
* AIME 24 (Light Green) - Solid Line
* HMMT 25 (Light Red) - Dashed Line
* GPQA-D (Light Yellow/Orange) - Solid Line
* **Titles:**
* Left Chart: "Avg Correlation r = -0.544"
* Right Chart: "Avg Correlation r = 0.828"
* **Correlation Labels:** Values of 'r' are displayed near each data point, indicating the correlation coefficient.
### Detailed Analysis or Content Details
**Left Chart (Accuracy vs. Token Count):**
* **AIME 25 (Light Blue, Dashed):** Starts at approximately 0.73 at a token count of 2500, rises to a peak of approximately 0.82 at 5000, then declines to approximately 0.70 at 10000. Correlation values near the points are: r = -0.704 (at 5000), r = -0.407 (at 10000).
* **AIME 24 (Light Green, Solid):** Starts at approximately 0.76 at 2500, rises to a peak of approximately 0.83 at 5000, then declines to approximately 0.74 at 10000. Correlation value near the point is: r = -0.284 (at 2500).
* **HMMT 25 (Light Red, Dashed):** Starts at approximately 0.68 at 2500, rises to approximately 0.73 at 7500, then declines to approximately 0.65 at 10000. Correlation value near the point is: r = -0.783 (at 7500).
* **GPQA-D (Light Yellow/Orange, Solid):** Starts at approximately 0.70 at 2500, remains relatively stable around 0.70-0.72 until 7500, then declines to approximately 0.66 at 10000. Correlation value near the point is: r = -0.284 (at 2500).
**Right Chart (Accuracy vs. Deep-Thinking Ratio):**
* **AIME 25 (Light Blue, Dashed):** Starts at approximately 0.72 at 0.135, rises steadily to approximately 0.88 at 0.180. Correlation values near the points are: r = 0.862 (at 0.150), r = 0.715 (at 0.180).
* **AIME 24 (Light Green, Solid):** Starts at approximately 0.74 at 0.135, rises steadily to approximately 0.89 at 0.180. Correlation value near the point is: r = 0.795 (at 0.180).
* **HMMT 25 (Light Red, Dashed):** Starts at approximately 0.58 at 0.135, rises steadily to approximately 0.68 at 0.180. Correlation value near the point is: r = 0.941 (at 0.165).
* **GPQA-D (Light Yellow/Orange, Solid):** Starts at approximately 0.70 at 0.135, rises to approximately 0.74 at 0.180. Correlation value near the point is: r = 0.795 (at 0.180).
### Key Observations
* **Left Chart:** Accuracy generally peaks around a token count of 5000 for AIME 25 and AIME 24, then decreases with increasing token count. HMMT 25 and GPQA-D show a more gradual decline. The average correlation is negative (-0.544), suggesting an inverse relationship between token count and accuracy for these models.
* **Right Chart:** Accuracy generally *increases* with increasing Deep-Thinking Ratio for all models. The average correlation is positive (0.828), indicating a strong positive relationship. HMMT 25 shows the most significant improvement with increasing Deep-Thinking Ratio.
* AIME 24 and AIME 25 consistently perform better than HMMT 25 and GPQA-D across both charts.
### Interpretation
The data suggests that increasing the token count beyond a certain point (around 5000) may not improve, and could even *decrease*, the accuracy of the AIME and GPQA-D models. This could be due to issues with overfitting or the introduction of noise with larger token counts.
Conversely, increasing the Deep-Thinking Ratio consistently improves the accuracy of all models. This indicates that allowing the models to engage in more complex reasoning processes is beneficial. The strong positive correlation (r = 0.828) on the right chart highlights this effect.
The negative correlation on the left chart (-0.544) suggests that simply increasing the amount of input data (token count) is not a substitute for more sophisticated reasoning. The models seem to benefit more from *how* they process information (Deep-Thinking Ratio) than from *how much* information they receive (Token Count).
The difference in performance between the models (AIME vs. HMMT/GPQA-D) suggests that the underlying architecture or training data of the AIME models may be more effective at leveraging both token count and deep thinking. The shaded areas around the lines represent confidence intervals, indicating the variability in the results. Further investigation would be needed to determine the statistical significance of these differences.