TECHNICAL ASSET FINGERPRINT
22f6f65d8e297f0a03c87597
Click to view fullscreen
Press ESC or click to close
FOUND IN PAPERS
EXPERT: healer-alpha-free VERSION 1
RUNTIME: free/openrouter/healer-alpha
INTEL_VERIFIED
## Scatter Plot Analysis: Model Accuracy vs. Token Count and Deep-Thinking Ratio
### Overview
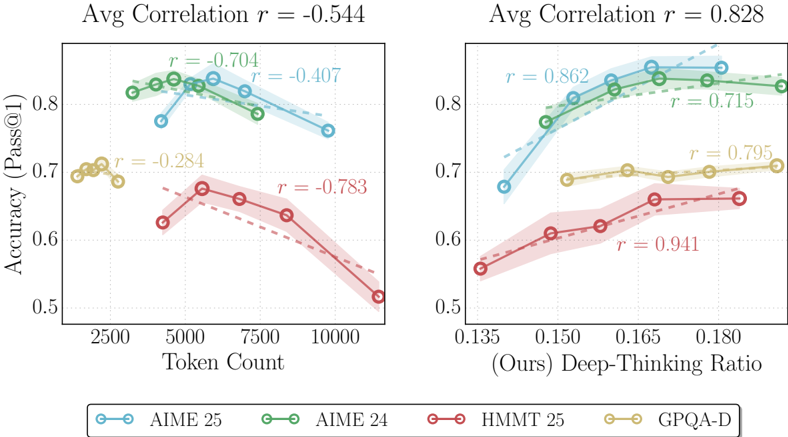
The image contains two side-by-side scatter plots with overlaid linear regression trend lines and shaded confidence intervals. Both plots share the same y-axis ("Accuracy (Pass@1)") and a common legend at the bottom. The left plot examines the relationship between accuracy and input "Token Count," while the right plot examines the relationship between accuracy and a metric called "(Ours) Deep-Thinking Ratio." The data is broken down into four distinct series, each represented by a specific color and marker style.
### Components/Axes
**Common Elements:**
* **Y-Axis (Both Plots):** Label: `Accuracy (Pass@1)`. Scale ranges from 0.5 to approximately 0.85, with major ticks at 0.5, 0.6, 0.7, and 0.8.
* **Legend (Bottom Center):** A horizontal legend defines the four data series:
* **AIME 25:** Blue line with open circle markers.
* **AIME 24:** Green line with open circle markers.
* **HMMT 25:** Red line with open circle markers.
* **GPQA-D:** Yellow/Gold line with open circle markers.
**Left Plot: Accuracy vs. Token Count**
* **Title (Top Center):** `Avg Correlation r = -0.544`
* **X-Axis:** Label: `Token Count`. Scale ranges from approximately 2000 to 11000, with major ticks at 2500, 5000, 7500, and 10000.
* **Data Series & Annotations:**
* **AIME 25 (Blue):** Trend line slopes downward. Annotated with `r = -0.704`.
* **AIME 24 (Green):** Trend line slopes downward. Annotated with `r = -0.407`.
* **HMMT 25 (Red):** Trend line slopes downward steeply. Annotated with `r = -0.783`.
* **GPQA-D (Yellow):** Trend line slopes downward gently. Annotated with `r = -0.284`.
**Right Plot: Accuracy vs. Deep-Thinking Ratio**
* **Title (Top Center):** `Avg Correlation r = 0.828`
* **X-Axis:** Label: `(Ours) Deep-Thinking Ratio`. Scale ranges from approximately 0.135 to 0.185, with major ticks at 0.135, 0.150, 0.165, and 0.180.
* **Data Series & Annotations:**
* **AIME 25 (Blue):** Trend line slopes upward. Annotated with `r = 0.862`.
* **AIME 24 (Green):** Trend line slopes upward. Annotated with `r = 0.715`.
* **HMMT 25 (Red):** Trend line slopes upward steeply. Annotated with `r = 0.941`.
* **GPQA-D (Yellow):** Trend line slopes upward gently. Annotated with `r = 0.795`.
### Detailed Analysis
**Left Plot (Token Count):**
* **AIME 25 (Blue):** Data points cluster between ~4000 and ~10000 tokens. Accuracy starts high (~0.82 at 4000 tokens) and declines to ~0.76 at 10000 tokens. The strong negative correlation (r = -0.704) confirms this downward trend.
* **AIME 24 (Green):** Data points span ~3000 to ~9000 tokens. Accuracy is consistently high, starting near ~0.83 and ending near ~0.82. The moderate negative correlation (r = -0.407) indicates a slight decline.
* **HMMT 25 (Red):** Data points span ~4000 to ~11000 tokens. Shows the most pronounced decline, from ~0.67 accuracy at 4000 tokens to ~0.51 at 11000 tokens. This is reflected in the strongest negative correlation (r = -0.783).
* **GPQA-D (Yellow):** Data points are clustered in a narrow range between ~2000 and ~3000 tokens. Accuracy is stable around ~0.70. The weak negative correlation (r = -0.284) suggests a minimal relationship within this limited token range.
**Right Plot (Deep-Thinking Ratio):**
* **AIME 25 (Blue):** As the ratio increases from ~0.135 to ~0.175, accuracy rises from ~0.68 to ~0.84. The very strong positive correlation (r = 0.862) indicates a robust relationship.
* **AIME 24 (Green):** Accuracy increases from ~0.77 at a ratio of ~0.145 to ~0.83 at ~0.180. Strong positive correlation (r = 0.715).
* **HMMT 25 (Red):** Shows the steepest ascent. Accuracy climbs from ~0.55 at a ratio of ~0.135 to ~0.66 at ~0.180. This series has the strongest correlation in the entire figure (r = 0.941).
* **GPQA-D (Yellow):** Accuracy increases gently from ~0.68 to ~0.71 as the ratio goes from ~0.150 to ~0.185. Strong positive correlation (r = 0.795).
### Key Observations
1. **Inverse Relationships:** All four model benchmarks show a negative correlation between accuracy and token count. Longer sequences are associated with lower pass@1 accuracy.
2. **Direct Relationships:** All four benchmarks show a strong positive correlation between accuracy and the "Deep-Thinking Ratio." A higher ratio is consistently associated with higher accuracy.
3. **Strength of Correlation:** The positive correlation with the Deep-Thinking Ratio (avg r = 0.828) is notably stronger than the negative correlation with Token Count (avg r = -0.544).
4. **Series Performance:** On the left plot, AIME 24 (Green) maintains the highest accuracy across token counts. On the right plot, AIME 25 (Blue) achieves the highest peak accuracy. HMMT 25 (Red) shows the most sensitivity (steepest slopes) to both variables.
5. **Data Distribution:** The GPQA-D (Yellow) series has a much narrower range of x-values (both token count and thinking ratio) compared to the other three series.
### Interpretation
The data presents a compelling narrative about the factors influencing model performance on these mathematical and reasoning benchmarks (AIME, HMMT, GPQA).
* **The Token Count Penalty:** The consistent negative correlation suggests that as problem complexity (inferred from longer token counts) increases, the model's ability to produce a correct answer on the first attempt diminishes. This could be due to increased reasoning steps, higher chance of error accumulation, or limitations in the model's effective context window for precise calculation.
* **The Deep-Thinking Dividend:** The strong positive correlation with the "(Ours) Deep-Thinking Ratio" is the central finding. This metric, presumably a measure of internal computation or reasoning depth allocated by the model, is a powerful predictor of success. The relationship is not merely present but is the strongest statistical signal in the analysis (avg r = 0.828, with HMMT 25 at r=0.941). This implies that the model's performance is highly dependent on its ability to engage in this "deep-thinking" process.
* **Practical Implication:** The contrast between the two plots suggests a potential trade-off or optimization path. While longer problems (high token count) are harder, allocating a higher "deep-thinking ratio" can effectively counteract this difficulty and even drive accuracy to new highs. The model's architecture or training likely incentivizes this deep-thinking behavior, and benchmarks that allow for it (like AIME 25) see the greatest benefits.
* **Benchmark Sensitivity:** The varying slopes and correlations indicate that different benchmarks stress different aspects of the model. HMMT 25 appears most sensitive to both sequence length and thinking depth, while GPQA-D, within its limited data range, shows more stability. This could reflect differences in problem style, required reasoning type, or dataset characteristics.
DECODING INTELLIGENCE...