```markdown
## Line Charts: Model Performance vs. Input Metrics
### Overview
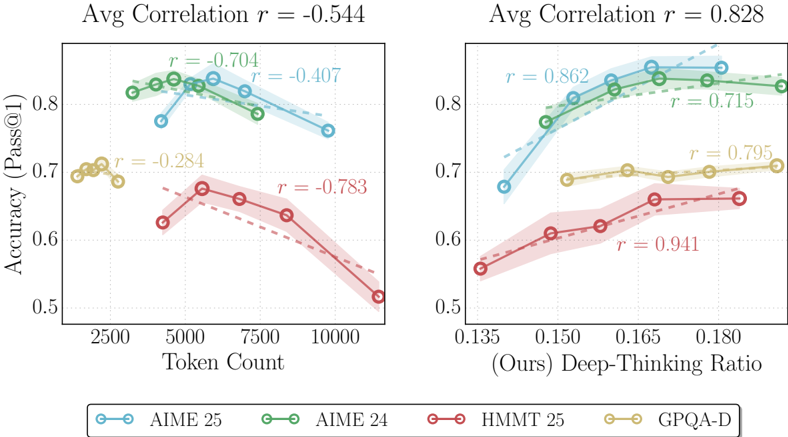
Two side-by-side line charts compare model accuracy (Pass@1) against two input metrics: Token Count (left) and Deep-Thinking Ratio (right). Each chart includes four models (AIME 25, AIME 24, HMMT 25, GPQA-D) with distinct color-coded lines and correlation coefficients (r-values). The left chart shows negative average correlation (r = -0.544), while the right chart shows strong positive correlation (r = 0.828).
### Components/Axes
**Left Chart (Token Count):**
- **X-axis**: Token Count (2500–10000)
- **Y-axis**: Accuracy (Pass@1) (0.5–0.8)
- **Legend**:
- Blue: AIME 25
- Green: AIME 24
- Red: HMMT 25
- Yellow: GPQA-D
- **Correlation Coefficients**:
- AIME 25: r = -0.704
- AIME 24: r = -0.407
- HMMT 25: r = -0.783
- GPQA-D: r = -0.284
**Right Chart (Deep-Thinking Ratio):**
- **X-axis**: Deep-Thinking Ratio (0.135–0.180)
- **Y-axis**: Accuracy (Pass@1) (0.5–0.8)
- **Legend**: Same color coding as left chart
- **Correlation Coefficients**:
- AIME 25: r = 0.862
- AIME 24: r = 0.715
- HMMT 25: r = 0.941
- GPQA-D: r = 0.795
### Detailed Analysis
**Left Chart Trends:**
1. **AIME 25 (Blue)**: Steep decline from ~0.82 at 2500 tokens to ~0.72 at 10000 tokens (r = -0.704).
2. **AIME 24 (Green)**: Slightly less steep decline, plateauing near 0.78–0.80 (r = -0.407).
3. **HMMT 25 (Red)**: Sharp drop from ~0.70 to ~0.52 (r = -0.783), most sensitive to token count.
4. **GPQA-D (Yellow)**: Minimal decline (0.70–0.68) (r = -0.284), most stable performance.
**Right Chart Trends:**
1. **AIME 25 (Blue)**: Strong upward slope from ~0.68 to ~0.85 (r = 0.862).
2. **AIME 24 (Green)**: Gradual increase from ~0.66 to ~0.82 (r = 0.715).
3. **HMMT 25 (Red)**: Steepest rise from ~0.55 to ~0.68 (r = 0.941), highest sensitivity to deep-thinking ratio.
4. **GPQA-D (Yellow)**: Moderate increase from ~0.68 to ~0.72 (r = 0.795).
### Key Observations
1. **Negative Correlation (Left Chart)**:
- All models except GPQA-D show declining accuracy with increased token count.
- HMMT 25 is most adversely affected (r = -0.783), suggesting inefficiency with large token inputs.
2. **Positive Correlation (Right Chart)**:
- All models improve accuracy with higher deep-thinking ratio.
- HMMT 25 demonstrates the strongest linear relationship (r = 0.941), indicating optimal utilization of this metric.
3. **Model Performance**:
- AIME models achieve highest baseline accuracy but suffer from token count sensitivity.
- GPQA-D maintains stability across token counts but lags in deep-thinking ratio responsiveness.
### Interpretation
The data reveals a critical trade-off between input efficiency and model performance:
- **Token Count Sensitivity**: AIME models (24/25) degrade sharply with larger inputs, while GPQA-D remains robust but less accurate. This suggests AIME models may be resource-intensive or poorly optimized for long-context tasks.
- **Deep-Thinking Ratio Efficacy**: