## Line Chart: Average Memory Usage During zk Generation Stages
### Overview
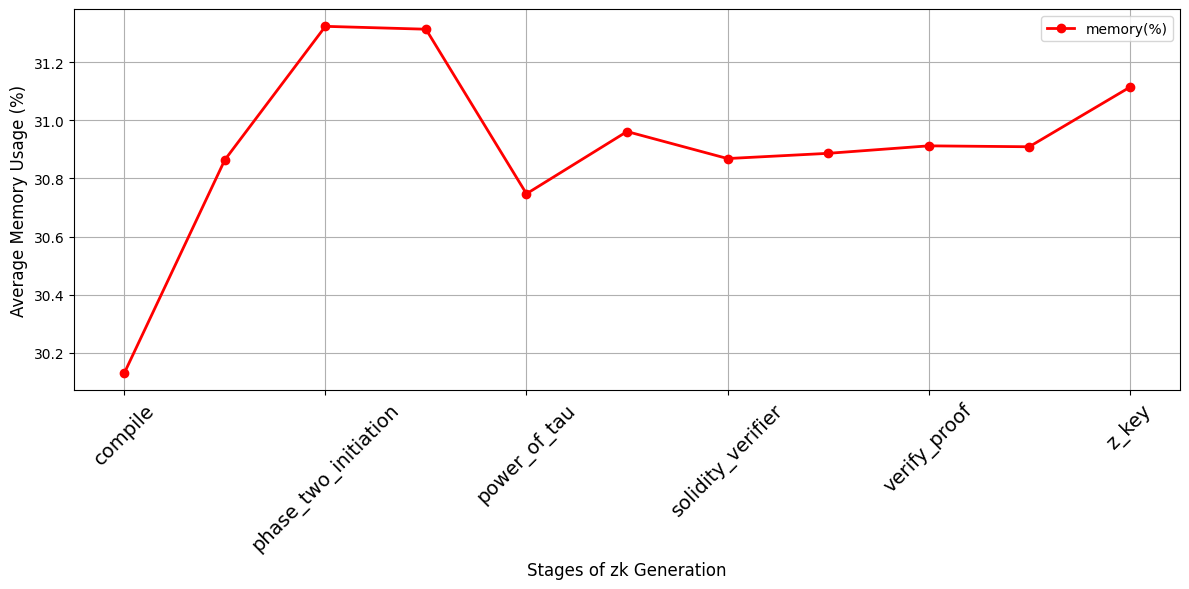
The image is a line chart showing the average memory usage (%) at different stages of zk (zero-knowledge) generation. The x-axis represents the stages of zk generation, and the y-axis represents the average memory usage in percentage. The chart displays a single data series representing memory usage across these stages.
### Components/Axes
* **X-axis:** Stages of zk Generation. The stages are: compile, phase\_two\_initiation, power\_of\_tau, solidity\_verifier, verify\_proof, and z\_key.
* **Y-axis:** Average Memory Usage (%). The y-axis ranges from approximately 30.2% to 31.2%.
* **Legend:** Located in the top-right corner, it indicates that the red line represents "memory(%)".
* **Grid:** The chart has a grid for easier value reading.
### Detailed Analysis
The red line represents the memory usage at each stage.
* **compile:** The memory usage starts at approximately 30.15%.
* **phase\_two\_initiation:** The memory usage increases sharply to approximately 31.3%.
* **power\_of\_tau:** The memory usage decreases to approximately 30.75%.
* **solidity\_verifier:** The memory usage remains relatively stable at approximately 30.88%.
* **verify\_proof:** The memory usage remains relatively stable at approximately 30.92%.
* **z\_key:** The memory usage increases to approximately 31.1%.
### Key Observations
* The "phase\_two\_initiation" stage has the highest memory usage.
* The "compile" stage has the lowest memory usage.
* Memory usage increases significantly from "compile" to "phase\_two\_initiation".
* Memory usage decreases from "phase\_two\_initiation" to "power\_of\_tau".
* Memory usage is relatively stable between "power\_of\_tau" and "verify\_proof".
* Memory usage increases again at the "z\_key" stage.
### Interpretation
The chart illustrates how memory usage varies across different stages of zk generation. The "phase\_two\_initiation" stage appears to be the most memory-intensive, while the "compile" stage uses the least memory. The trend suggests that memory usage is dynamic and dependent on the specific operations performed at each stage. The initial spike and subsequent stabilization could indicate an initial setup phase followed by more consistent processing. The final increase at the "z\_key" stage might indicate finalization or output operations.