\n
## Line Chart: Average Memory Usage During zk Generation Stages
### Overview
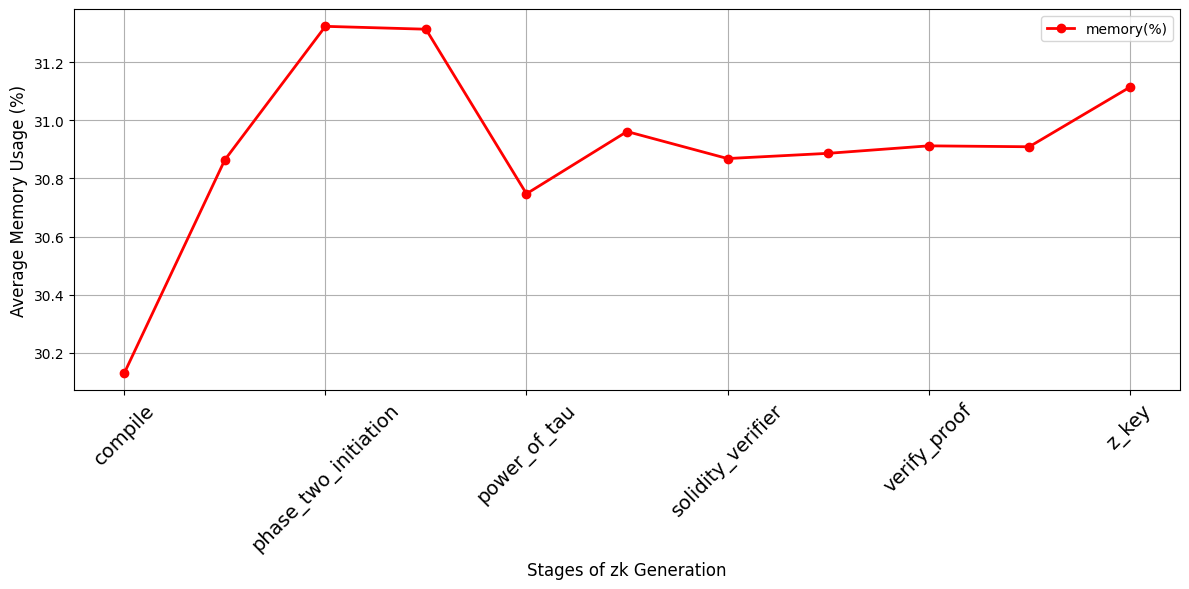
This line chart depicts the average memory usage (in percentage) across different stages of Zero-Knowledge (zk) generation. The x-axis represents the stages, and the y-axis represents the average memory usage percentage. A single data series, labeled "memory (%)", is plotted as a red line.
### Components/Axes
* **X-axis Title:** "Stages of zk Generation"
* **Y-axis Title:** "Average Memory Usage (%)"
* **Y-axis Scale:** Ranges from approximately 30.2% to 31.2% with increments of 0.2%.
* **X-axis Categories:** "compile", "phase_two_initiation", "power_of_tau", "solidity_verifier", "verify_proof", "z_key"
* **Legend:** Located in the top-right corner.
* "memory (%)" - Represented by a red line.
### Detailed Analysis
The line representing "memory (%)" exhibits fluctuations across the different stages.
* **compile:** Starts at approximately 30.2%.
* **phase_two_initiation:** Increases sharply to a peak of approximately 31.2%.
* **power_of_tau:** Decreases significantly to approximately 30.8%.
* **solidity_verifier:** Decreases slightly to approximately 30.7%.
* **verify_proof:** Increases slightly to approximately 30.8%.
* **z_key:** Increases to approximately 31.0%.
Here's a more detailed breakdown of the approximate values:
| Stage | Memory Usage (%) |
| ---------------------- | ---------------- |
| compile | 30.2 |
| phase_two_initiation | 31.2 |
| power_of_tau | 30.8 |
| solidity_verifier | 30.7 |
| verify_proof | 30.8 |
| z_key | 31.0 |
### Key Observations
* The highest memory usage occurs during the "phase_two_initiation" stage, reaching approximately 31.2%.
* The lowest memory usage is observed during the "compile" stage, at approximately 30.2%.
* The memory usage generally fluctuates, with no consistently increasing or decreasing trend across all stages.
* The "power_of_tau" stage shows a significant drop in memory usage after the peak at "phase_two_initiation".
### Interpretation
The chart illustrates the varying memory demands of different stages within a zk generation process. The peak during "phase_two_initiation" suggests this stage is the most resource-intensive in terms of memory. The subsequent decrease during "power_of_tau" could indicate that this stage involves different computational operations that are less memory-intensive. The relatively stable memory usage during "solidity_verifier" and "verify_proof" suggests these stages have consistent memory requirements. The final increase during "z_key" generation might be due to the finalization or storage of the generated key.
This data is valuable for optimizing the zk generation process. Identifying the stages with high memory usage allows developers to focus on optimizing those specific areas to reduce overall resource consumption. The fluctuations suggest that different stages require different optimization strategies. For example, the "phase_two_initiation" stage might benefit from memory allocation strategies or algorithm improvements, while other stages might require different approaches.