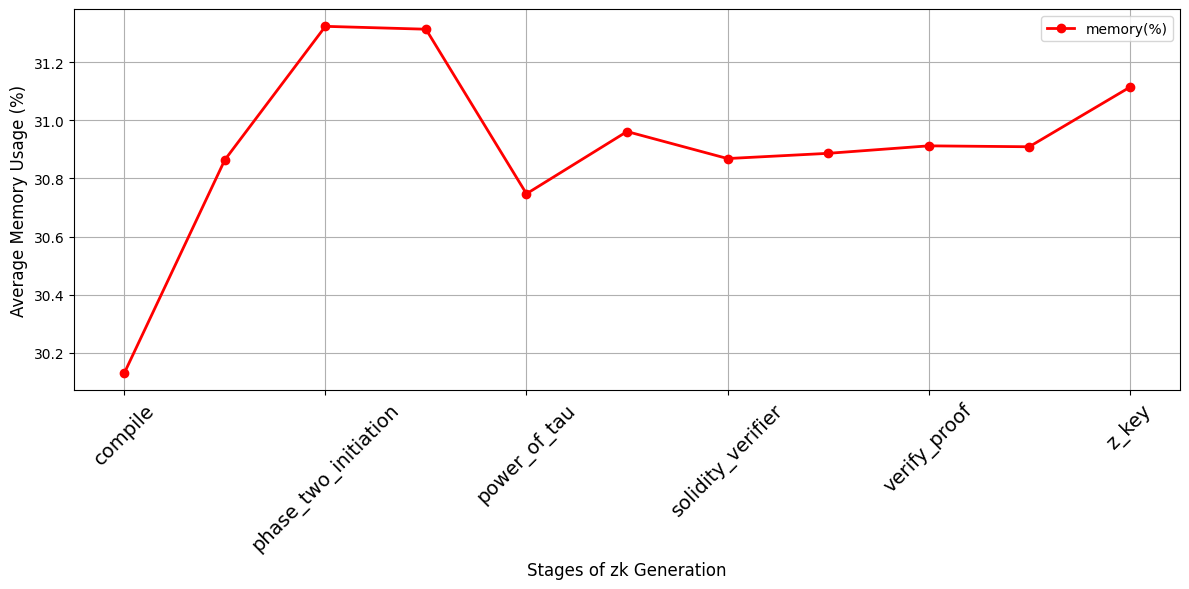
## Line Chart: Memory Usage Across zk Generation Stages
### Overview
This image is a line chart displaying the average memory usage (as a percentage) across various stages of a zero-knowledge (zk) proof generation process. The chart tracks a single data series, showing how memory consumption fluctuates through the sequential stages.
### Components/Axes
* **Chart Type:** Line chart with data points marked by red circles.
* **X-Axis (Horizontal):**
* **Title:** "Stages of zk Generation"
* **Categories (from left to right):** `compile`, `phase_two_initiation`, `power_of_tau`, `solidity_verifier`, `verify_proof`, `z_key`.
* **Note:** The axis labels are rotated approximately 45 degrees for readability.
* **Y-Axis (Vertical):**
* **Title:** "Average Memory Usage (%)"
* **Scale:** Linear scale ranging from approximately 30.0% to 31.4%.
* **Major Gridlines:** Present at intervals of 0.2% (30.2, 30.4, 30.6, 30.8, 31.0, 31.2).
* **Legend:**
* **Location:** Top-right corner of the chart area.
* **Content:** A red line with a circle marker labeled "memory(%)".
* **Data Series:**
* **Label:** "memory(%)"
* **Visual Representation:** A solid red line connecting red circular data points.
### Detailed Analysis
The chart plots memory usage for six distinct stages. The trend is not monotonic; it features a sharp initial rise, a peak, a significant drop, and a gradual recovery.
**Data Points & Trend Verification:**
1. **`compile`**: The line starts at its lowest point. **Approximate Value:** 30.13%.
2. **`phase_two_initiation`**: The line slopes steeply upward to its highest peak. **Approximate Value:** 31.33%.
3. **`power_of_tau`**: The line slopes steeply downward to a local minimum. **Approximate Value:** 30.75%.
4. **`solidity_verifier`**: The line slopes gently upward. **Approximate Value:** 30.96%.
5. **`verify_proof`**: The line continues with a very slight upward slope, appearing almost flat. **Approximate Value:** 30.91%.
6. **`z_key`**: The line slopes upward again to its second-highest point. **Approximate Value:** 31.11%.
**Spatial Grounding:** All data points are plotted directly above their corresponding x-axis category labels. The legend is positioned in the upper right quadrant, clearly associated with the red line.
### Key Observations
* **Peak Memory Demand:** The `phase_two_initiation` stage is the most memory-intensive, consuming over 31.3% on average.
* **Significant Drop:** There is a notable decrease in memory usage (approximately 0.58 percentage points) between `phase_two_initiation` and `power_of_tau`.
* **Stabilization and Rise:** After the drop at `power_of_tau`, memory usage stabilizes around the 30.9% mark for `solidity_verifier` and `verify_proof` before rising again for the final `z_key` stage.
* **Overall Range:** Memory usage across all stages varies within a relatively narrow band of approximately 1.2 percentage points (from ~30.13% to ~31.33%).
### Interpretation
This chart provides a technical profile of the memory footprint for a zk-proof generation pipeline. The data suggests that the process is not uniformly resource-intensive.
* **Resource Allocation:** System designers or operators should anticipate the highest memory allocation requirements during the `phase_two_initiation` stage. The `compile` stage is the most lightweight in terms of memory.
* **Process Insight:** The sharp drop after the peak could indicate the completion of a major, memory-heavy sub-process (like large-scale polynomial commitment or setup) within `phase_two_initiation`, after which resources are freed before the `power_of_tau` stage begins.
* **Bottleneck Identification:** While `z_key` shows high usage, the most critical potential bottleneck for memory-constrained systems appears to be the `phase_two_initiation` phase. Optimizing this stage could yield the greatest benefit for reducing overall memory requirements.
* **Stability:** The relatively flat usage between `solidity_verifier` and `verify_proof` suggests these stages have consistent and predictable memory demands.
The chart effectively communicates that memory usage is stage-dependent, with clear peaks and valleys that are crucial for performance tuning and infrastructure planning in zk-proof systems.