## Line Chart: Average Memory Usage (%) Across Stages of zk Generation
### Overview
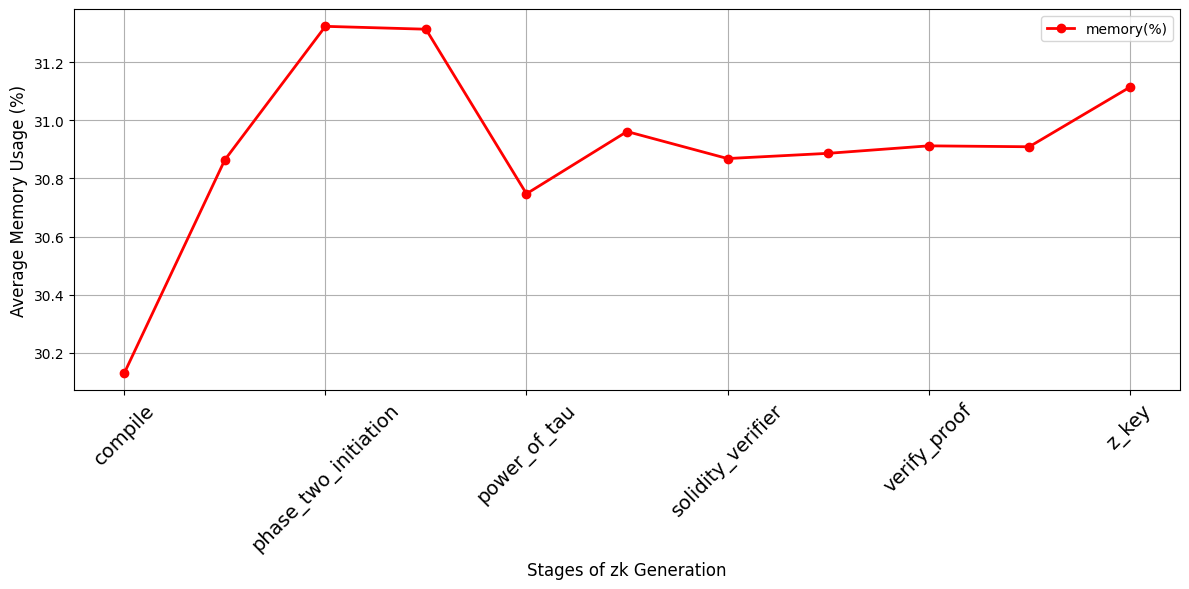
The chart illustrates the average memory usage (in percentage) across six stages of zero-knowledge (zk) generation. The x-axis represents the stages, while the y-axis shows memory usage from 30.2% to 31.4%. A single red line labeled "memory(%)" tracks the trend.
### Components/Axes
- **X-Axis (Stages of zk Generation)**:
- `compile`
- `phase_two_initiation`
- `power_of_tau`
- `solidity_verifier`
- `verify_proof`
- `z_key`
- **Y-Axis (Average Memory Usage %)**:
- Scale: 30.2% to 31.4% (increments of 0.1%).
- **Legend**:
- Located in the top-right corner.
- Red line corresponds to "memory(%)".
### Detailed Analysis
1. **Compile**:
- Memory usage starts at **~30.1%**, the lowest point on the chart.
2. **Phase_two_initiation**:
- Sharp increase to **~31.4%**, the highest peak.
3. **Power_of_tau**:
- Slight drop to **~31.3%**.
4. **Solidity_verifier**:
- Further decline to **~30.9%**.
5. **Verify_proof**:
- Stabilizes at **~30.9%**.
6. **Z_key**:
- Final peak at **~31.1%**.
### Key Observations
- **Highest Memory Usage**: Occurs at `phase_two_initiation` (~31.4%) and `z_key` (~31.1%).
- **Lowest Memory Usage**: At `compile` (~30.1%).
- **Trend**: Initial spike at `phase_two_initiation`, followed by fluctuations, with a final rise at `z_key`.
### Interpretation
The chart suggests that memory usage is heavily concentrated in the `phase_two_initiation` and `z_key` stages, likely due to computationally intensive operations such as cryptographic proofs or key generation. The `compile` stage uses minimal memory, indicating it involves lighter tasks. The fluctuations between stages highlight varying resource demands, with `solidity_verifier` and `verify_proof` showing relatively stable usage. The final peak at `z_key` underscores its critical role in the zk generation process, possibly involving complex cryptographic computations.