## Horizontal Bar Chart: Most Frequent Guesses
### Overview
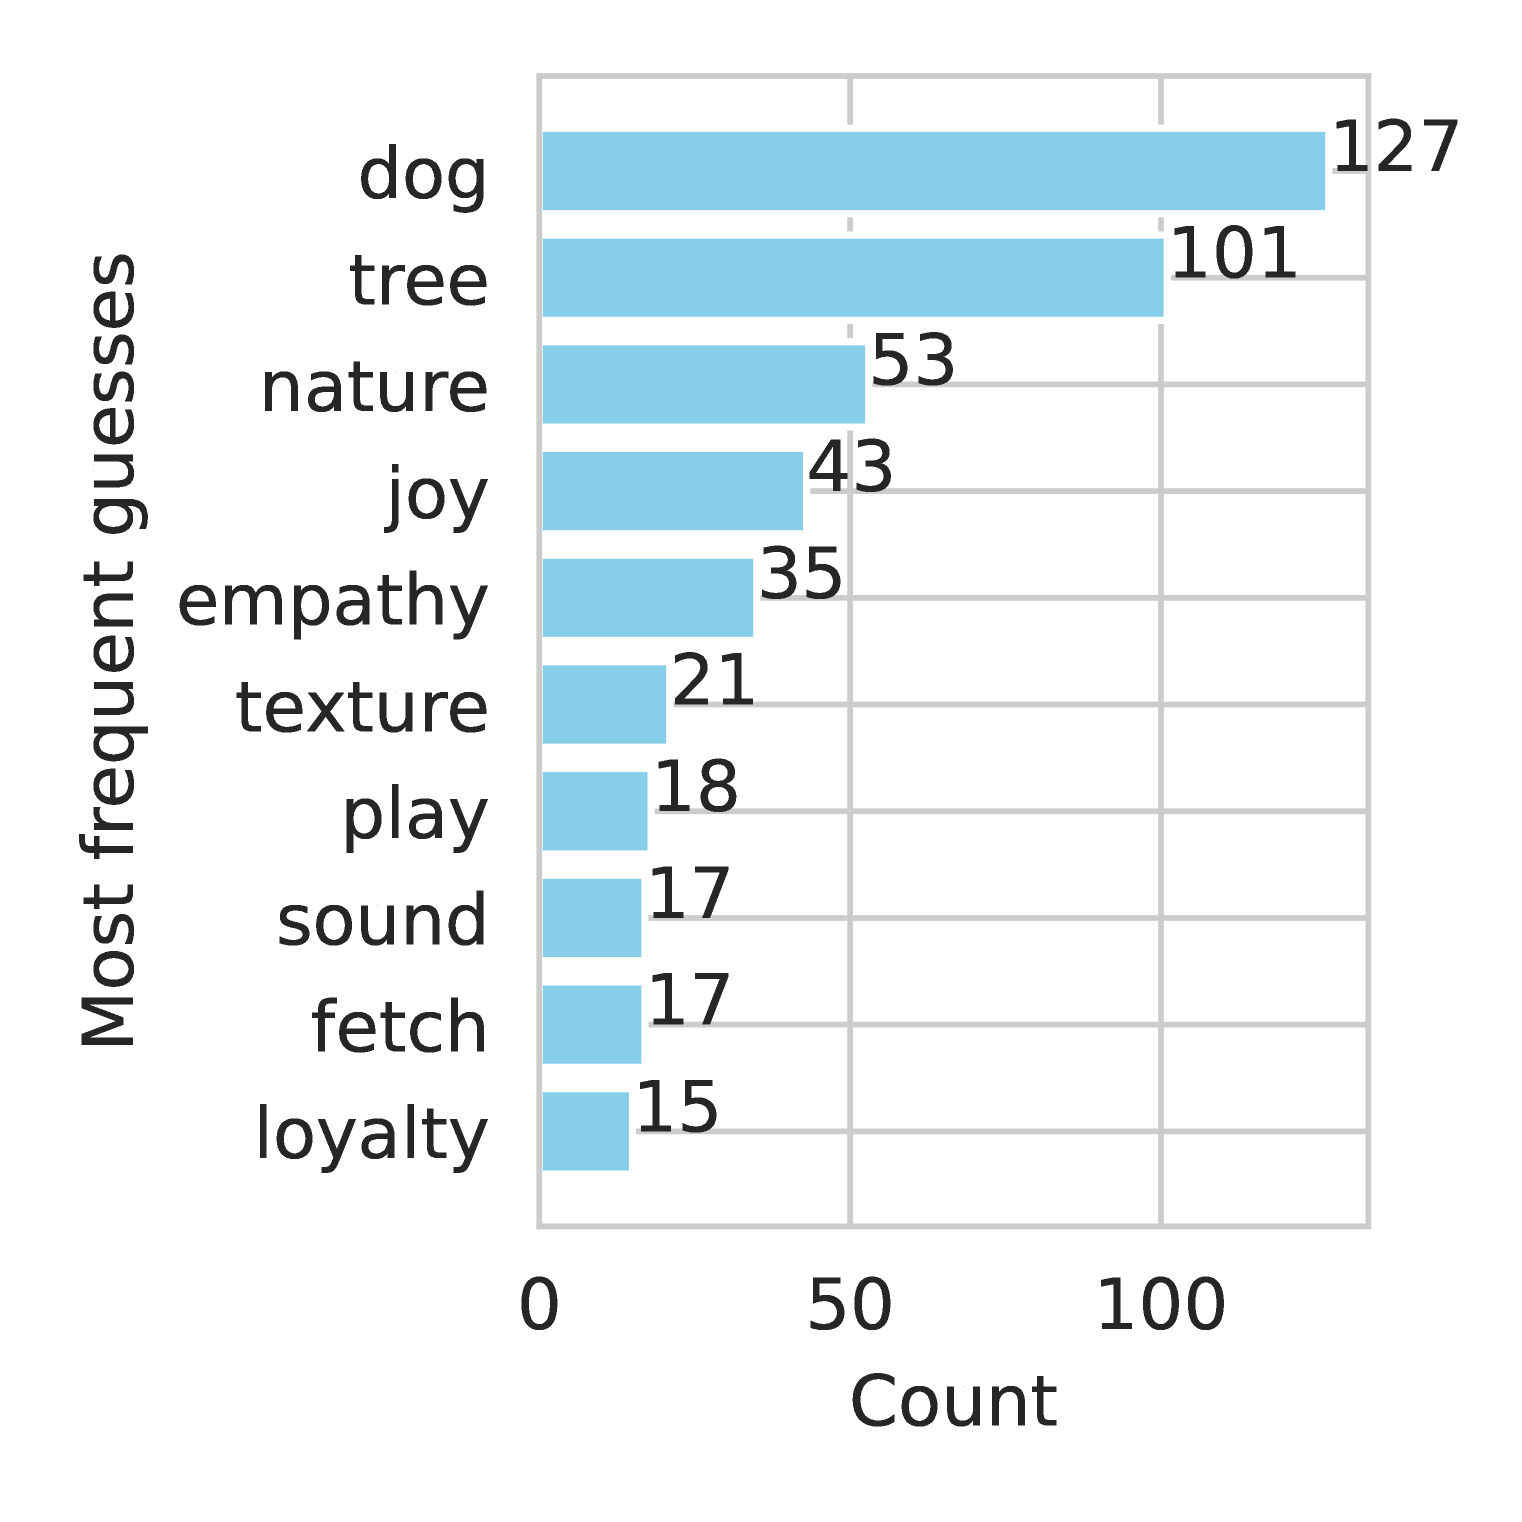
The image is a horizontal bar chart displaying the frequency of different guesses. The y-axis lists the guesses, and the x-axis represents the count of each guess. The bars are light blue, and the counts are displayed at the end of each bar.
### Components/Axes
* **Y-axis Label:** "Most frequent guesses" (vertical text)
* **X-axis Label:** "Count"
* **Y-axis Categories:** dog, tree, nature, joy, empathy, texture, play, sound, fetch, loyalty
* **X-axis Scale:** 0 to 100, with tick marks at 0, 50, and 100.
### Detailed Analysis
The bar chart displays the following counts for each category:
* **dog:** 127
* **tree:** 101
* **nature:** 53
* **joy:** 43
* **empathy:** 35
* **texture:** 21
* **play:** 18
* **sound:** 17
* **fetch:** 17
* **loyalty:** 15
### Key Observations
* "dog" is the most frequent guess, with a count of 127.
* "tree" is the second most frequent guess, with a count of 101.
* The frequency of guesses decreases significantly after "tree".
* "loyalty" is the least frequent guess, with a count of 15.
* "sound" and "fetch" have the same count of 17.
### Interpretation
The bar chart indicates the relative frequency of different guesses, with "dog" and "tree" being the most common. The data suggests that these two concepts are strongly associated with the subject being guessed. The other guesses are significantly less frequent, indicating a weaker association. The chart provides a clear visual representation of the distribution of guesses and highlights the most prominent associations.