\n
## Horizontal Bar Chart: Most Frequent Guesses
### Overview
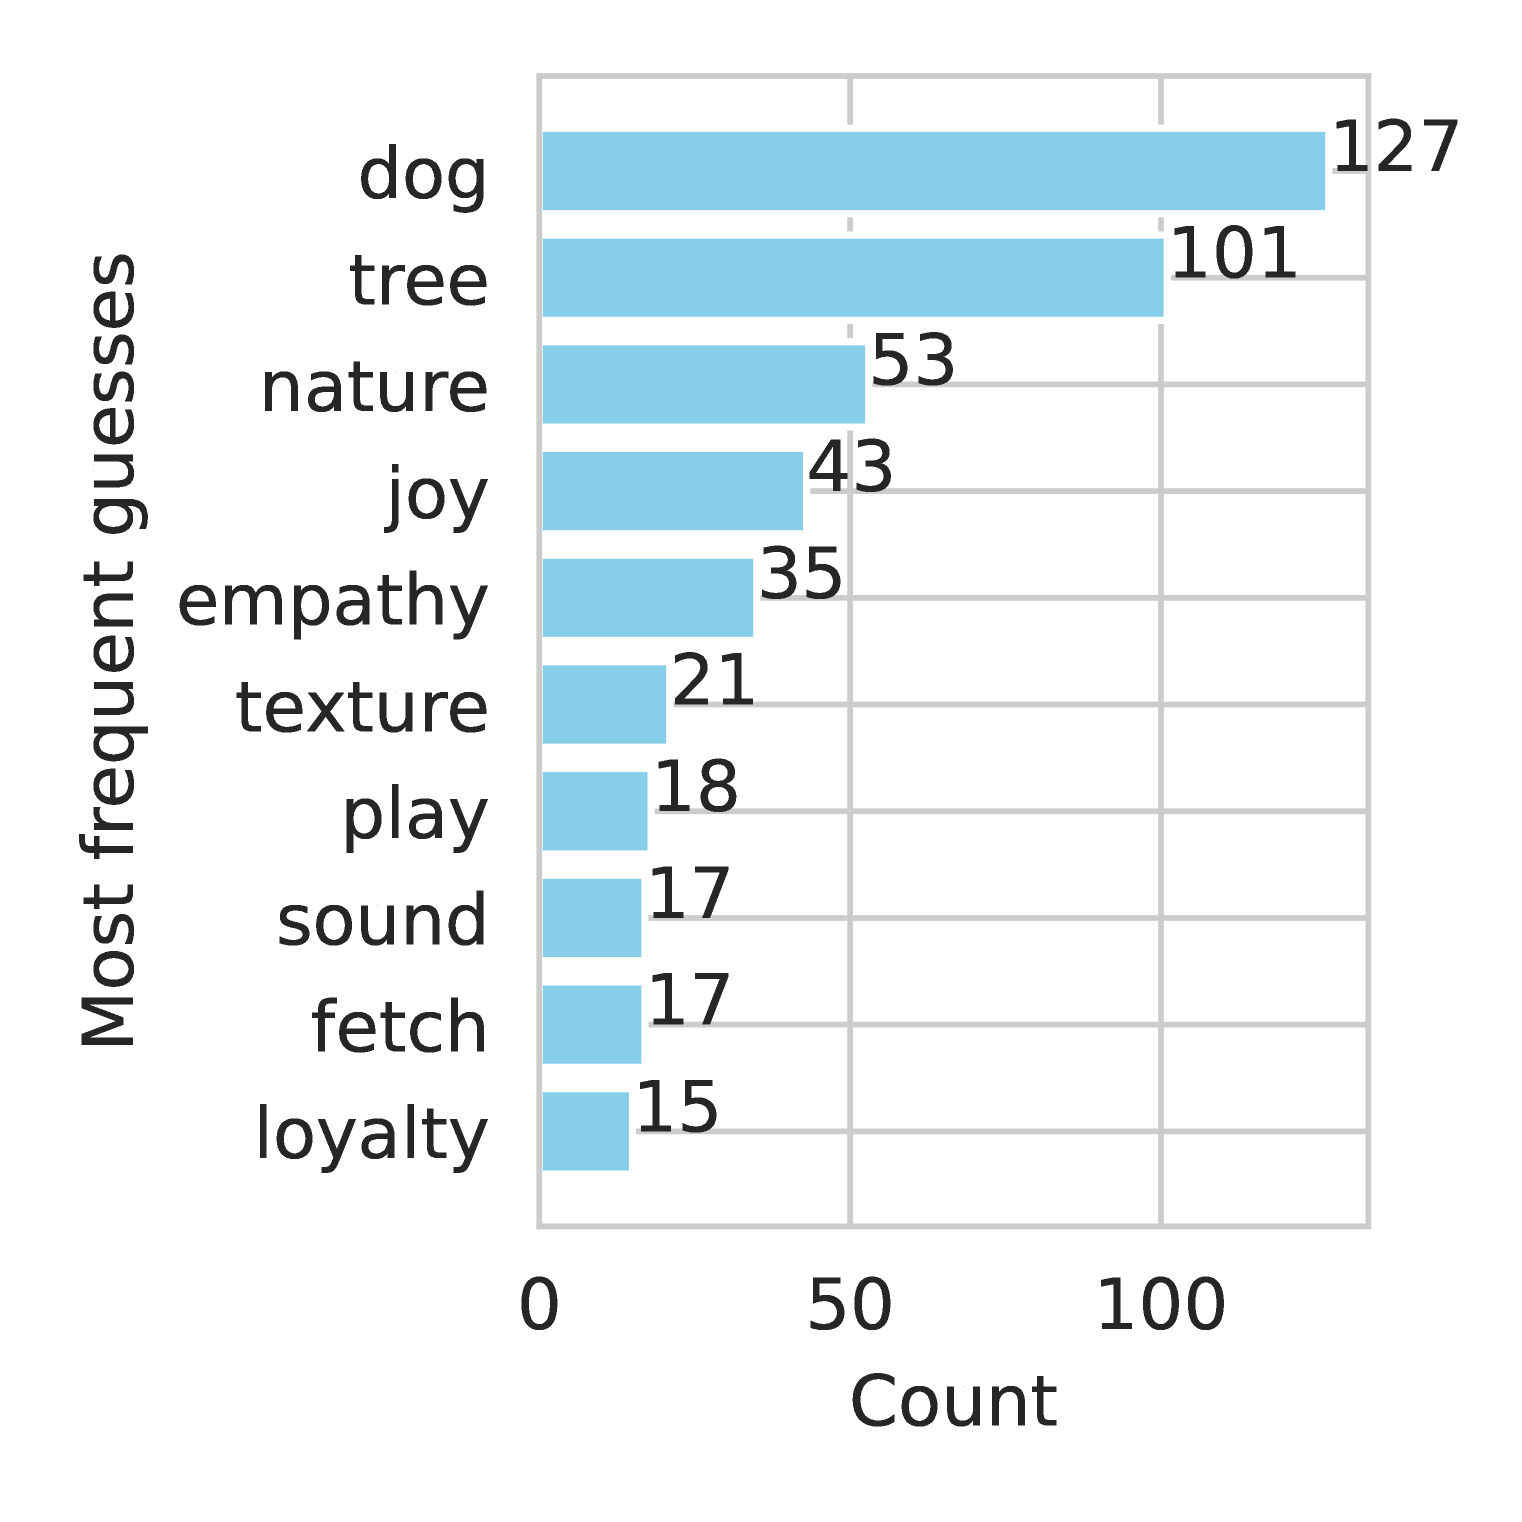
This image presents a horizontal bar chart displaying the frequency of guesses for various terms. The chart visualizes the count of each guess, ordered from most frequent to least frequent.
### Components/Axes
* **Y-axis (Vertical):** Labeled "Most frequent guesses". The categories listed are: dog, tree, nature, joy, empathy, texture, play, sound, fetch, loyalty.
* **X-axis (Horizontal):** Labeled "Count". The scale ranges from 0 to 100, with increments of 50.
* **Bars:** Each bar represents a guess category, with the length of the bar corresponding to its count. The bars are colored a light blue.
* **Gridlines:** Vertical gridlines are present at intervals of 50 along the x-axis.
### Detailed Analysis
The chart displays the following data points:
* **dog:** Count = 127
* **tree:** Count = 101
* **nature:** Count = 53
* **joy:** Count = 43
* **empathy:** Count = 35
* **texture:** Count = 21
* **play:** Count = 18
* **sound:** Count = 17
* **fetch:** Count = 17
* **loyalty:** Count = 15
The bars generally decrease in length as you move down the y-axis, indicating a decreasing frequency of guesses. The "dog" guess has a significantly higher count than all other guesses.
### Key Observations
* "Dog" is by far the most frequent guess, with a count of 127, substantially higher than the next most frequent guess ("tree" at 101).
* "Fetch" and "sound" have the same count (17).
* The counts decrease relatively steadily from "dog" to "loyalty", with some minor fluctuations.
* The guesses appear to relate to positive associations with animals or the natural world.
### Interpretation
The data suggests that, within the context of whatever guessing game or survey this data represents, "dog" is the most prominent or readily associated concept. "Tree" and "nature" also appear frequently, indicating a strong connection to the natural world. The presence of terms like "joy", "empathy", "play", "fetch", and "loyalty" suggests that the guesses are likely related to positive emotional or behavioral attributes, potentially associated with pets or animals in general. The relatively low counts for "texture", "sound", "fetch", and "loyalty" indicate these are less common associations.
The chart could be illustrating the results of a word association test, a survey about favorite things, or a game where participants guess concepts based on clues. The dominance of "dog" suggests a strong cultural or personal connection to dogs within the sample population. The data could be used to understand preferences, associations, or common themes within a specific group.