## Bar Chart: Most Frequent Guesses
### Overview
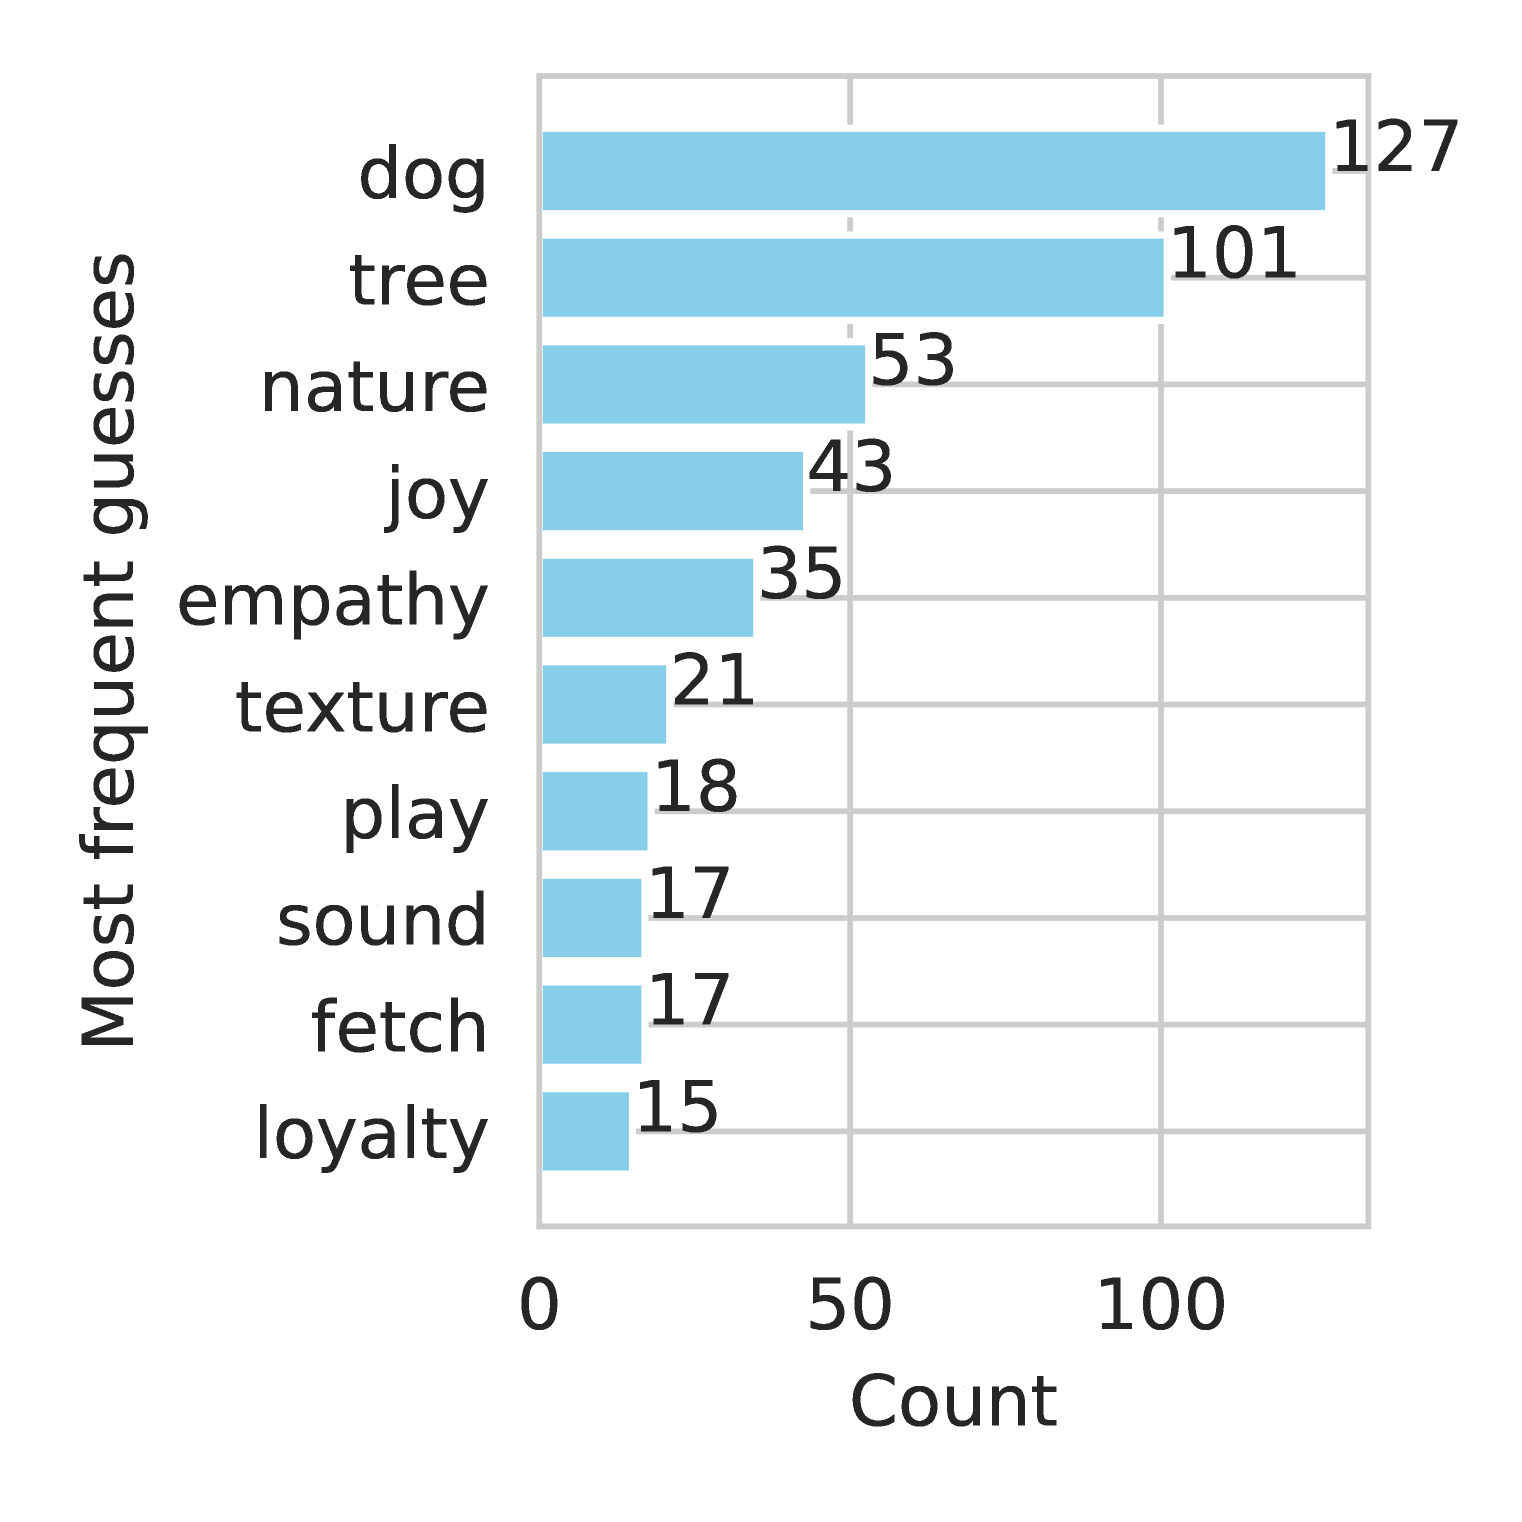
The chart displays a horizontal bar visualization of "Most frequent guesses" across 10 categories. The x-axis represents numerical counts (0–127), while the y-axis lists categorical labels. All bars are rendered in blue, with numerical values explicitly annotated at the end of each bar.
### Components/Axes
- **Y-Axis (Categories)**:
- dog
- tree
- nature
- joy
- empathy
- texture
- play
- sound
- fetch
- loyalty
- **X-Axis (Count)**:
- Scale ranges from 0 to 127 in increments of 25.
- Label: "Count"
- **Legend**: Not explicitly visible in the image. All bars share the same blue color, suggesting a single data series.
### Detailed Analysis
1. **dog**: 127 (longest bar, occupying ~90% of the x-axis range)
2. **tree**: 101 (~75% of x-axis range)
3. **nature**: 53 (~40% of x-axis range)
4. **joy**: 43 (~32% of x-axis range)
5. **empathy**: 35 (~26% of x-axis range)
6. **texture**: 21 (~16% of x-axis range)
7. **play**: 18 (~13% of x-axis range)
8. **sound**: 17 (~12% of x-axis range)
9. **fetch**: 17 (~12% of x-axis range)
10. **loyalty**: 15 (~11% of x-axis range)
### Key Observations
- **Dominance of Top Categories**: "dog" and "tree" account for 70% of the total count (228/328), far exceeding other categories.
- **Mid-Range Drop**: Categories 3–5 ("nature," "joy," "empathy") show a steep decline from 53 to 35, indicating a sharp drop-off in frequency.
- **Tie in Lower Ranks**: "sound" and "fetch" share identical counts (17), while "play" (18) and "loyalty" (15) cluster closely at the bottom.
- **Bar Length Correlation**: Longer bars (e.g., "dog") visually align with higher numerical values, confirming accurate spatial grounding.
### Interpretation
The data suggests a hierarchical structure in guessing frequency, with "dog" and "tree" being overwhelmingly dominant. The steep decline after the top five categories implies that most guesses concentrate on a small subset of options. The tie between "sound" and "fetch" may indicate ambiguity in distinguishing these categories during the guessing process. The near-identical counts for "play" and "loyalty" suggest these concepts are either equally obscure or similarly peripheral in the context of the study. The absence of a legend simplifies interpretation but limits multi-series analysis. The chart’s design prioritizes clarity, using explicit numerical annotations to avoid misinterpretation of bar lengths.