## Line Chart: Development Accuracy vs. Epoch
### Overview
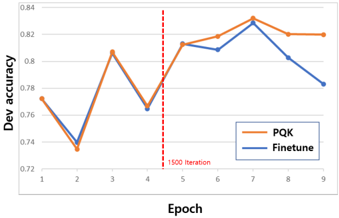
This line chart displays the development accuracy of two models, "PQK" and "Finetune", across nine epochs. The x-axis represents the epoch number, and the y-axis represents the development accuracy. A vertical dashed red line indicates the 1500 iteration mark.
### Components/Axes
* **X-axis:** Epoch (ranging from 1 to 9)
* **Y-axis:** Dev accuracy (ranging from approximately 0.72 to 0.84)
* **Data Series 1:** PQK (represented by an orange line)
* **Data Series 2:** Finetune (represented by a blue line)
* **Legend:** Located in the top-right corner, labeling the two data series with their corresponding colors.
* **Vertical Line:** Dashed red line at Epoch 5, labeled "1500 Iteration".
### Detailed Analysis
**PQK (Orange Line):**
The PQK line exhibits an initial decrease in accuracy from Epoch 1 (approximately 0.77) to Epoch 2 (approximately 0.73). It then increases sharply to Epoch 3 (approximately 0.81), followed by a decrease to Epoch 4 (approximately 0.76). From Epoch 4, the line increases again, reaching a peak at Epoch 7 (approximately 0.83), then decreases slightly to Epoch 8 (approximately 0.82), and remains relatively stable at Epoch 9 (approximately 0.82).
* Epoch 1: ~0.77
* Epoch 2: ~0.73
* Epoch 3: ~0.81
* Epoch 4: ~0.76
* Epoch 5: ~0.81
* Epoch 6: ~0.82
* Epoch 7: ~0.83
* Epoch 8: ~0.82
* Epoch 9: ~0.82
**Finetune (Blue Line):**
The Finetune line starts at Epoch 1 with an accuracy of approximately 0.76. It decreases to a minimum at Epoch 2 (approximately 0.74), then increases steadily to Epoch 7 (approximately 0.83). After Epoch 7, the line decreases to Epoch 8 (approximately 0.80) and continues to decrease to Epoch 9 (approximately 0.78).
* Epoch 1: ~0.76
* Epoch 2: ~0.74
* Epoch 3: ~0.78
* Epoch 4: ~0.79
* Epoch 5: ~0.81
* Epoch 6: ~0.80
* Epoch 7: ~0.83
* Epoch 8: ~0.80
* Epoch 9: ~0.78
### Key Observations
* Both models show fluctuations in development accuracy across epochs.
* The PQK model generally exhibits higher accuracy than the Finetune model, especially after Epoch 5.
* The vertical dashed line at Epoch 5 (1500 iterations) appears to mark a point where the PQK model begins to outperform the Finetune model more consistently.
* Both models reach their peak accuracy around Epoch 7.
* The Finetune model shows a more pronounced decrease in accuracy in the later epochs (8 and 9).
### Interpretation
The chart suggests that the PQK model achieves better development accuracy than the Finetune model over the observed epochs, particularly after the 1500 iteration mark. The initial fluctuations in both models' accuracy could be attributed to the learning process and the model's adaptation to the training data. The peak accuracy around Epoch 7 indicates a point of optimal performance for both models. The subsequent decline in accuracy, especially for the Finetune model, might suggest overfitting or the need for further regularization. The 1500 iteration mark could represent a significant point in the training process where the PQK model's learning strategy becomes more effective. The data suggests that PQK is a more robust model for this task, or that the finetuning process requires further optimization.