## Line Graph: Development Accuracy Comparison Across Epochs
### Overview
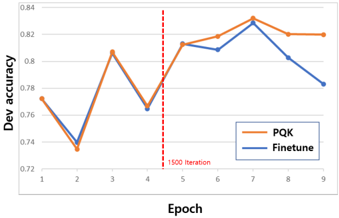
The image depicts a line graph comparing the development accuracy of two methods, **PQK** (orange line) and **Finetune** (blue line), across 9 training epochs. A vertical red dashed line marks the "1500 Iteration" at Epoch 4. The y-axis represents development accuracy (ranging from 0.72 to 0.84), while the x-axis represents epochs (1–9).
---
### Components/Axes
- **X-axis (Epoch)**: Labeled "Epoch" with integer markers from 1 to 9.
- **Y-axis (Dev accuracy)**: Labeled "Dev accuracy" with decimal values from 0.72 to 0.84 in increments of 0.02.
- **Legend**: Located in the bottom-right corner, with orange representing **PQK** and blue representing **Finetune**.
- **Red Dashed Line**: Vertical line at Epoch 4 labeled "1500 Iteration."
---
### Detailed Analysis
#### PQK (Orange Line)
- **Epoch 1**: ~0.77
- **Epoch 2**: ~0.73
- **Epoch 3**: ~0.81
- **Epoch 4**: ~0.76
- **Epoch 5**: ~0.81
- **Epoch 6**: ~0.82
- **Epoch 7**: ~0.83
- **Epoch 8**: ~0.82
- **Epoch 9**: ~0.82
#### Finetune (Blue Line)
- **Epoch 1**: ~0.77
- **Epoch 2**: ~0.74
- **Epoch 3**: ~0.81
- **Epoch 4**: ~0.76
- **Epoch 5**: ~0.81
- **Epoch 6**: ~0.81
- **Epoch 7**: ~0.83
- **Epoch 8**: ~0.80
- **Epoch 9**: ~0.78
---
### Key Observations
1. **Red Dashed Line**: The "1500 Iteration" at Epoch 4 aligns with a local minimum for both methods (~0.76 accuracy).
2. **PQK Trends**:
- Sharp dip at Epoch 2 (~0.73), followed by recovery.
- Peaks at Epoch 7 (~0.83), then stabilizes.
3. **Finetune Trends**:
- V-shaped dip at Epochs 2–4 (~0.74–0.76), then steady improvement.
- Peaks at Epoch 7 (~0.83), followed by a decline.
4. **Convergence**: Both methods reach their highest accuracy at Epoch 7 (~0.83), suggesting optimal performance at this point.
---
### Interpretation
- **Training Dynamics**: The red dashed line at Epoch 4 ("1500 Iteration") may indicate a critical training milestone (e.g., phase transition or hyperparameter adjustment). Both methods show improved stability after this point.
- **Method Comparison**:
- **PQK** exhibits sharper fluctuations early on but stabilizes faster post-Epoch 4.
- **Finetune** shows a more gradual recovery after the initial dip, with sustained performance until Epoch 7.
- **Optimal Epoch**: Epoch 7 represents the peak for both methods, suggesting that extending training beyond this point may lead to overfitting or diminishing returns (e.g., Finetune’s decline after Epoch 7).
- **Uncertainty**: Values are approximate due to the absence of gridlines or exact numerical annotations. The red line’s placement at Epoch 4 is precise, but accuracy values are inferred from visual estimation.
---
### Conclusion
The graph highlights the trade-offs between PQK and Finetune in terms of convergence speed and stability. The "1500 Iteration" marker at Epoch 4 serves as a pivotal reference point, with both methods achieving peak performance shortly thereafter. Further analysis could explore why Finetune’s accuracy declines after Epoch 7, potentially indicating overfitting or sensitivity to hyperparameters.