## Composite Diagram: Evolution and Deployment of Transformer-Based AI Models
### Overview
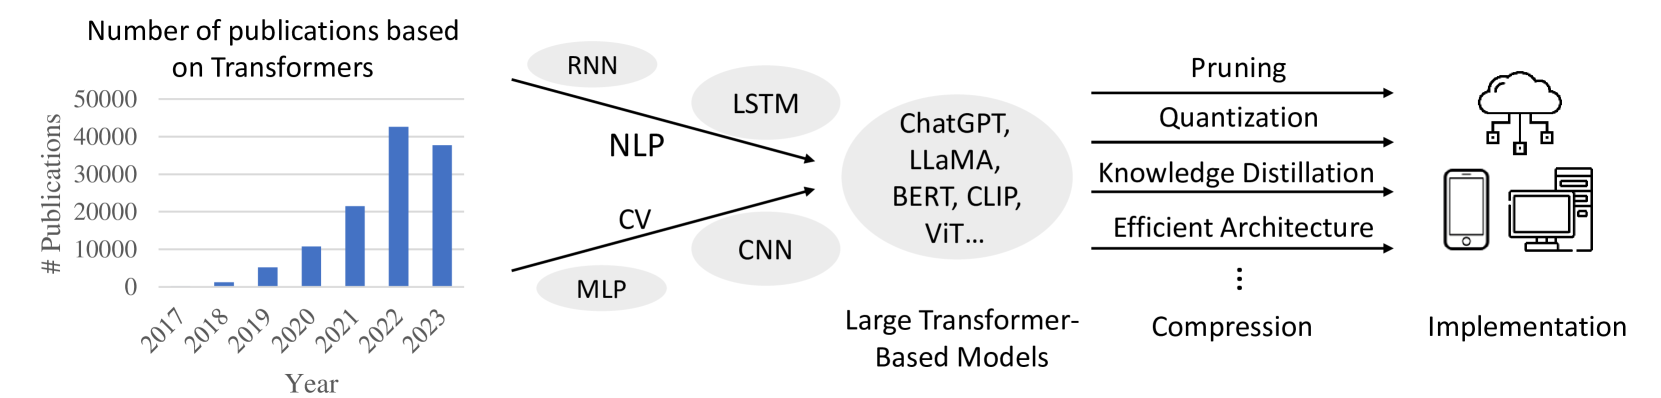
The image is a composite technical diagram illustrating the growth of Transformer-based research, the evolution of AI model architectures leading to large Transformer-based models, and the subsequent pipeline for compressing and deploying these models. It consists of three main sections arranged horizontally from left to right: a bar chart, a flow diagram of model evolution, and a deployment pipeline.
### Components/Axes
**1. Left Section: Bar Chart**
* **Title:** "Number of publications based on Transformers"
* **X-axis:** Labeled "Year". Categories: 2017, 2018, 2019, 2020, 2021, 2022, 2023.
* **Y-axis:** Labeled "# Publications". Scale markers: 0, 10000, 20000, 30000, 40000, 50000.
* **Data Series:** A single series of blue vertical bars representing the publication count for each year.
**2. Center Section: Model Evolution Flow Diagram**
* **Left Cluster (Pre-Transformer Architectures):** Six light gray ovals containing text:
* Top: "RNN"
* Upper Middle: "LSTM"
* Middle: "NLP" (connected via arrow to central oval)
* Lower Middle: "CV" (connected via arrow to central oval)
* Bottom: "MLP"
* Bottom Right: "CNN"
* **Central Oval (Target Models):** A large, light gray oval containing the text: "ChatGPT, LLaMA, BERT, CLIP, ViT..." The ellipsis (...) indicates this is a non-exhaustive list.
* **Label Below Central Oval:** "Large Transformer-Based Models"
* **Arrows:** Two black arrows originate from the "NLP" and "CV" ovals, pointing directly to the central "Large Transformer-Based Models" oval.
**3. Right Section: Compression and Implementation Pipeline**
* **Compression Techniques:** Four horizontal black arrows point from left to right. Above each arrow is a label:
* "Pruning"
* "Quantization"
* "Knowledge Distillation"
* "Efficient Architecture"
* **Ellipsis:** Below the fourth arrow, three vertical dots ("...") indicate additional, unspecified compression techniques.
* **Label Below Arrows:** "Compression"
* **Implementation Icons:** On the far right, three black line-art icons represent deployment targets:
* Top: A cloud with network connections (representing cloud/server deployment).
* Middle: A smartphone (representing mobile deployment).
* Bottom: A desktop computer and server tower (representing edge/desktop deployment).
* **Label Below Icons:** "Implementation"
### Detailed Analysis
**Bar Chart Data (Approximate Values):**
* **Trend Verification:** The data series shows a clear, steep upward trend from 2017 to 2022, followed by a slight decline in 2023.
* **2017:** ~0 publications (bar is barely visible).
* **2018:** ~1,000 publications.
* **2019:** ~5,000 publications.
* **2020:** ~11,000 publications.
* **2021:** ~21,000 publications.
* **2022:** ~42,000 publications (peak).
* **2023:** ~37,000 publications.
**Flow Diagram Relationships:**
* The diagram positions "NLP" (Natural Language Processing) and "CV" (Computer Vision) as the primary application domains driving the development of large Transformer-based models, as indicated by the direct arrows.
* Other architectures like RNN, LSTM, MLP, and CNN are shown as related or predecessor technologies in the same conceptual space but without direct arrows to the central models.
**Compression Pipeline:**
* The four listed techniques (Pruning, Quantization, Knowledge Distillation, Efficient Architecture) are presented as parallel or sequential methods for model compression.
* The flow is linear: Large Transformer-Based Models → Compression Techniques → Implementation on various hardware (cloud, mobile, desktop).
### Key Observations
1. **Exponential Growth:** The publication chart demonstrates explosive, near-exponential growth in Transformer research from 2018 to 2022.
2. **Peak and Plateau:** The year 2022 represents the peak of publication volume, with a noticeable but not drastic decrease in 2023, suggesting a potential maturation or consolidation phase in the field.
3. **Central Role of Transformers:** The diagram's structure places "Large Transformer-Based Models" as the central, convergent outcome of prior work in NLP and CV.
4. **Deployment Focus:** The rightmost section highlights that a major current challenge in the field is not just creating large models, but compressing them for practical "Implementation" across diverse computing environments.
### Interpretation
This diagram tells a concise story of a technological paradigm shift. The bar chart provides quantitative evidence of a research revolution centered on Transformers, peaking around 2022. The flow diagram contextualizes this revolution, showing how it synthesized advances from both language (NLP) and vision (CV) domains, moving beyond older architectures like RNNs and CNNs.
The most critical insight lies in the pipeline's conclusion: the creation of massive models (like ChatGPT, LLaMA) is not the end goal. The diagram argues that the current frontier is **compression**—making these powerful but resource-intensive models efficient enough for real-world **implementation** on everyday devices (phones, desktops) and cloud infrastructure. The ellipsis under "Compression" acknowledges this is an active, open area of research with many emerging techniques. The overall message is one of rapid theoretical advancement now grappling with the practical engineering challenges of deployment.