## Bar Charts: Speedup Comparison of Sorting Algorithms
### Overview
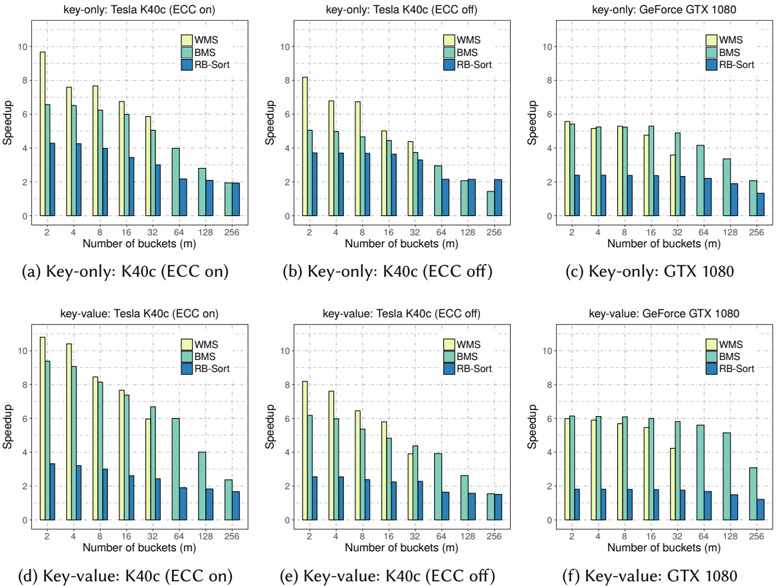
The image presents six bar charts comparing the speedup achieved by three sorting algorithms – WMS, BMS, and RB-Sort – across different numbers of buckets. The charts vary based on the key used (key-only vs. key-value) and the GPU used (Tesla K40c, Tesla K40c with ECC off, GeForce GTX 1080). Each chart displays speedup on the y-axis against the number of buckets on the x-axis.
### Components/Axes
* **X-axis:** Number of buckets (m), with markers at 2, 4, 8, 16, 32, 64, 128, and 256.
* **Y-axis:** Speedup, ranging from 0 to 10.
* **Legend:** Located at the top-right of each chart, indicating the sorting algorithm:
* WMS (represented by a light blue color)
* BMS (represented by a medium blue color)
* RB-Sort (represented by a dark blue color)
* **Titles:** Each chart has a title indicating the key type (key-only or key-value) and the GPU used, along with ECC status (on or off). The titles are labeled (a) through (f).
### Detailed Analysis or Content Details
**Chart (a): Key-only: K40c (ECC on)**
* **WMS:** Starts at approximately 9.2 speedup for 2 buckets, decreases to around 2.5 speedup for 256 buckets. The trend is downward sloping.
* **BMS:** Starts at approximately 8.5 speedup for 2 buckets, decreases to around 2.2 speedup for 256 buckets. The trend is downward sloping.
* **RB-Sort:** Starts at approximately 7.5 speedup for 2 buckets, decreases to around 2.0 speedup for 256 buckets. The trend is downward sloping.
**Chart (b): Key-only: K40c (ECC off)**
* **WMS:** Starts at approximately 9.5 speedup for 2 buckets, decreases to around 2.7 speedup for 256 buckets. The trend is downward sloping.
* **BMS:** Starts at approximately 8.8 speedup for 2 buckets, decreases to around 2.4 speedup for 256 buckets. The trend is downward sloping.
* **RB-Sort:** Starts at approximately 7.8 speedup for 2 buckets, decreases to around 2.1 speedup for 256 buckets. The trend is downward sloping.
**Chart (c): Key-only: GTX 1080**
* **WMS:** Starts at approximately 8.0 speedup for 2 buckets, decreases to around 2.0 speedup for 256 buckets. The trend is downward sloping.
* **BMS:** Starts at approximately 7.5 speedup for 2 buckets, decreases to around 1.8 speedup for 256 buckets. The trend is downward sloping.
* **RB-Sort:** Starts at approximately 6.5 speedup for 2 buckets, decreases to around 1.6 speedup for 256 buckets. The trend is downward sloping.
**Chart (d): Key-value: K40c (ECC on)**
* **WMS:** Starts at approximately 9.0 speedup for 2 buckets, decreases to around 2.4 speedup for 256 buckets. The trend is downward sloping.
* **BMS:** Starts at approximately 8.3 speedup for 2 buckets, decreases to around 2.1 speedup for 256 buckets. The trend is downward sloping.
* **RB-Sort:** Starts at approximately 7.3 speedup for 2 buckets, decreases to around 1.9 speedup for 256 buckets. The trend is downward sloping.
**Chart (e): Key-value: K40c (ECC off)**
* **WMS:** Starts at approximately 9.3 speedup for 2 buckets, decreases to around 2.6 speedup for 256 buckets. The trend is downward sloping.
* **BMS:** Starts at approximately 8.6 speedup for 2 buckets, decreases to around 2.3 speedup for 256 buckets. The trend is downward sloping.
* **RB-Sort:** Starts at approximately 7.6 speedup for 2 buckets, decreases to around 2.0 speedup for 256 buckets. The trend is downward sloping.
**Chart (f): Key-value: GTX 1080**
* **WMS:** Starts at approximately 7.8 speedup for 2 buckets, decreases to around 1.9 speedup for 256 buckets. The trend is downward sloping.
* **BMS:** Starts at approximately 7.3 speedup for 2 buckets, decreases to around 1.7 speedup for 256 buckets. The trend is downward sloping.
* **RB-Sort:** Starts at approximately 6.3 speedup for 2 buckets, decreases to around 1.5 speedup for 256 buckets. The trend is downward sloping.
### Key Observations
* All algorithms exhibit a decreasing speedup as the number of buckets increases.
* The Tesla K40c generally provides higher speedup than the GeForce GTX 1080.
* Enabling ECC (Error Correcting Code) appears to have a minor impact on speedup, with the "ECC off" configurations showing slightly higher values in some cases.
* WMS consistently achieves the highest speedup across all configurations.
* RB-Sort consistently achieves the lowest speedup across all configurations.
### Interpretation
The data demonstrates the performance characteristics of three sorting algorithms on different GPUs and with varying key types and ECC settings. The inverse relationship between speedup and the number of buckets suggests that the algorithms become less efficient as the data is divided into more partitions. This is likely due to increased overhead associated with managing a larger number of buckets.
The superior performance of the Tesla K40c compared to the GeForce GTX 1080 indicates that the K40c is better suited for these types of sorting tasks, potentially due to its architecture or memory bandwidth. The minor impact of ECC suggests that the benefits of error correction do not significantly outweigh the performance cost in this scenario.
The consistent ranking of the algorithms (WMS > BMS > RB-Sort) suggests that WMS is the most efficient algorithm for this workload, while RB-Sort is the least efficient. The choice of key type (key-only vs. key-value) also influences performance, but the effect is relatively small compared to the GPU and algorithm choices. The data suggests that optimizing the number of buckets is crucial for maximizing performance, and the optimal number of buckets may depend on the specific GPU and algorithm used.