## [Grouped Bar Charts]: Speedup Comparison of Sorting Algorithms on Different GPU Hardware Configurations
### Overview
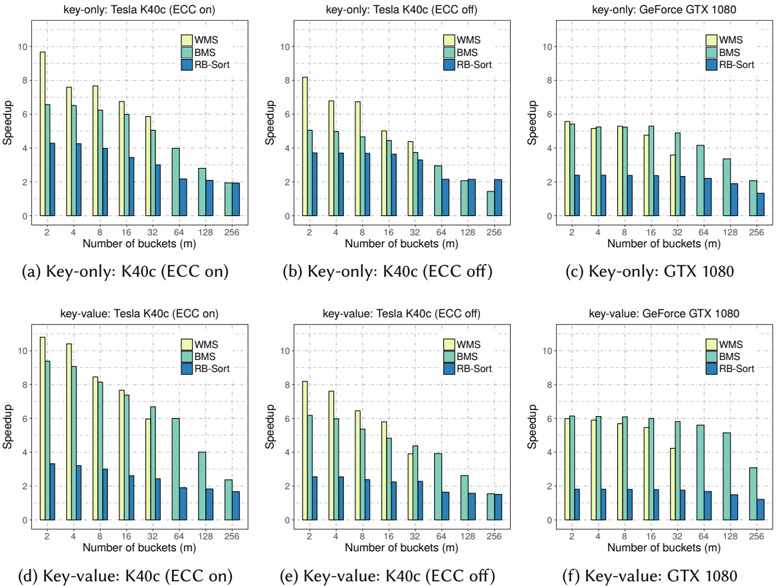
The image displays a set of six grouped bar charts arranged in a 2x3 grid. The charts compare the performance speedup of three sorting algorithms (WMS, BMS, RB-Sort) across two data types ("key-only" and "key-value") and three GPU hardware/ECC configurations. The performance is measured as speedup relative to a baseline (not specified in the image) as a function of the number of buckets used in the sorting process.
### Components/Axes
* **Chart Layout:** Six individual charts labeled (a) through (f).
* **Top Row (Key-only):** (a) Tesla K40c (ECC on), (b) Tesla K40c (ECC off), (c) GeForce GTX 1080.
* **Bottom Row (Key-value):** (d) Tesla K40c (ECC on), (e) Tesla K40c (ECC off), (f) GeForce GTX 1080.
* **Common Axes (All Charts):**
* **X-axis:** Label: "Number of buckets (m)". Categories (markers): 2, 4, 8, 16, 32, 64, 128, 256.
* **Y-axis:** Label: "Speedup". Scale: 0 to 10 (or 12 in some charts), with major ticks every 2 units.
* **Legend (Present in each chart, top-right corner):**
* **WMS:** Light green bar.
* **BMS:** Teal/cyan bar.
* **RB-Sort:** Dark blue bar.
* **Chart Titles:** Each chart has a title at the top indicating the data type and hardware configuration (e.g., "key-only: Tesla K40c (ECC on)").
### Detailed Analysis
**Trend Verification & Data Points (Approximate values):**
**Top Row - Key-only Data:**
* **(a) K40c (ECC on):** All algorithms show a clear downward trend in speedup as the number of buckets increases. WMS starts highest (~9.8 at m=2) and declines steadily. BMS starts around 6.5 and declines. RB-Sort starts around 4.2 and declines. At m=256, all are below 2.
* **(b) K40c (ECC off):** Similar downward trend. WMS starts slightly lower than in (a) (~8.2 at m=2). BMS and RB-Sort start around 4.8 and 3.5 respectively. The decline is consistent.
* **(c) GTX 1080:** The trend is much flatter. Speedup for WMS and BMS is relatively stable between 5 and 6 for m=2 to m=16, then begins a gradual decline. RB-Sort is consistently lower, starting around 2.5 and declining slowly. All values are lower than the peak values on the K40c.
**Bottom Row - Key-value Data:**
* **(d) K40c (ECC on):** Similar downward trend to key-only. WMS starts very high (~10.8 at m=2). BMS starts around 9.2. RB-Sort starts around 3.2. The decline is steep, especially for WMS and BMS.
* **(e) K40c (ECC off):** Downward trend continues. WMS starts around 8.2, BMS around 6.2, RB-Sort around 2.5. The values are generally lower than with ECC on for the same hardware.
* **(f) GTX 1080:** Again, a much flatter trend. WMS and BMS are stable around 6 for m=2 to m=16 before a slight decline. RB-Sort is stable around 1.8 before a slight decline. Performance is notably lower than on the K40c for low bucket counts.
### Key Observations
1. **Dominant Trend:** For all configurations on the Tesla K40c (charts a, b, d, e), speedup decreases significantly as the number of buckets (m) increases. This trend is less pronounced on the GeForce GTX 1080 (charts c, f).
2. **Algorithm Performance:** WMS (light green) consistently achieves the highest speedup, followed by BMS (teal), with RB-Sort (dark blue) being the slowest across all charts and bucket counts.
3. **Impact of ECC:** Comparing (a) vs (b) and (d) vs (e), disabling ECC memory on the Tesla K40c generally results in lower speedup values for all algorithms, particularly for WMS and BMS at low bucket counts.
4. **Hardware Comparison:** The GeForce GTX 1080 shows lower peak speedups but much more stable performance across different bucket counts compared to the Tesla K40c. The K40c excels with very few buckets but degrades rapidly.
5. **Data Type Impact:** The "key-value" data type (bottom row) shows a similar pattern to "key-only" but with slightly different absolute values. The relative performance between algorithms and the trends across hardware remain consistent.
### Interpretation
The data suggests a fundamental trade-off in the parallel sorting algorithms being tested. The high speedup at low bucket counts (m) on the powerful Tesla K40c indicates excellent parallel efficiency when the problem can be divided into a few large, independent chunks. However, as the number of buckets increases (likely leading to more synchronization, communication overhead, or smaller, less efficient work units), the performance advantage diminishes sharply.
The GeForce GTX 1080, while having lower peak throughput, demonstrates more consistent performance, suggesting its architecture or memory subsystem is less sensitive to the granularity change imposed by increasing bucket count. The negative impact of enabling ECC memory on the K40c is expected, as ECC introduces overhead for error checking and correction, but the charts quantify this cost for these specific algorithms.
The consistent ranking of WMS > BMS > RB-Sort implies that the WMS algorithm is the most optimized for the parallel GPU architecture under these test conditions, regardless of the hardware configuration or data type. The charts effectively communicate that algorithm choice (WMS) and hardware configuration (K40c with ECC off) are critical for maximizing performance when the sorting problem can be structured with a small number of buckets.