## Line Chart: Success Rate vs. Avg Inference Count
### Overview
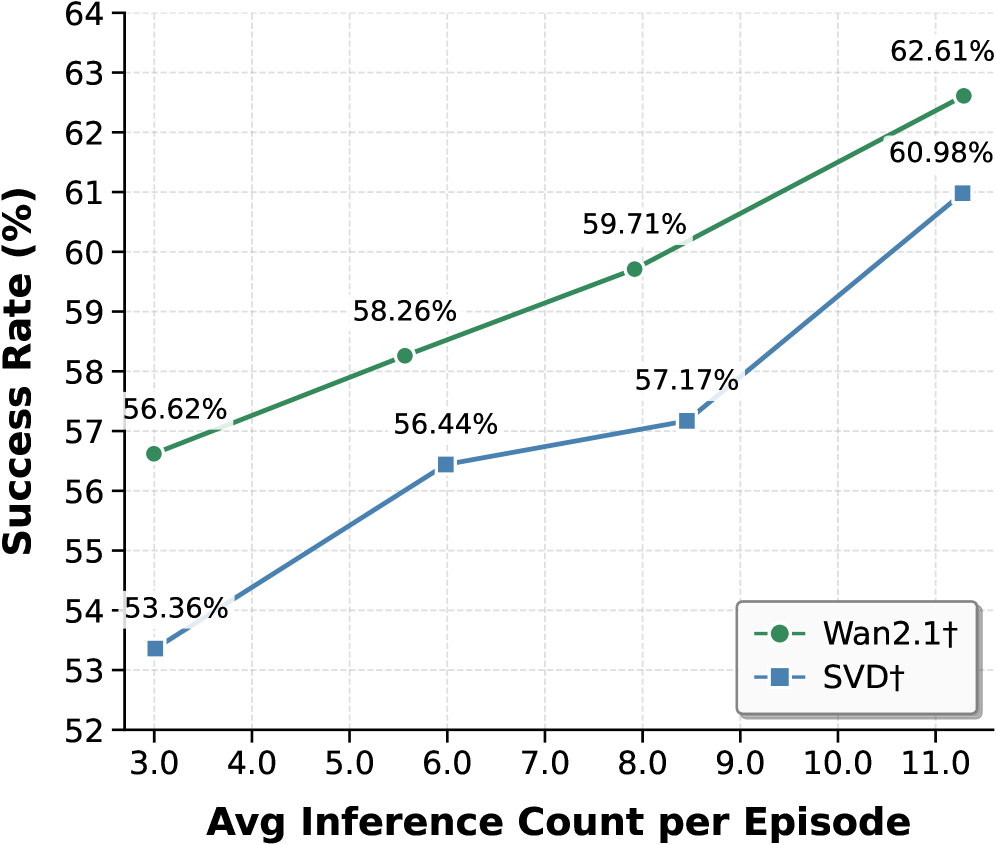
The image is a line chart comparing the success rate (%) of two methods, Wan2.1 and SVD, against the average inference count per episode. The x-axis represents the average inference count per episode, ranging from 3.0 to 11.0. The y-axis represents the success rate in percentage, ranging from 52% to 64%.
### Components/Axes
* **X-axis:** Avg Inference Count per Episode (ranging from 3.0 to 11.0 in increments of 1.0)
* **Y-axis:** Success Rate (%) (ranging from 52 to 64 in increments of 1)
* **Legend:** Located in the bottom-right corner.
* Green line with circle markers: Wan2.1†
* Blue line with square markers: SVD†
### Detailed Analysis
* **Wan2.1† (Green Line):** The success rate generally increases with the average inference count per episode.
* At 3.0 inference count, the success rate is 56.62%.
* At 6.0 inference count, the success rate is 58.26%.
* At 8.0 inference count, the success rate is 59.71%.
* At 11.0 inference count, the success rate is 62.61%.
* **SVD† (Blue Line):** The success rate also increases with the average inference count per episode.
* At 3.0 inference count, the success rate is 53.36%.
* At 6.0 inference count, the success rate is 56.44%.
* At 8.0 inference count, the success rate is 57.17%.
* At 11.0 inference count, the success rate is 60.98%.
### Key Observations
* Both Wan2.1 and SVD show an increase in success rate as the average inference count per episode increases.
* Wan2.1 consistently outperforms SVD across all measured inference counts.
* The SVD line shows a steeper increase in success rate between inference counts of 8.0 and 11.0 compared to the segment between 3.0 and 6.0.
### Interpretation
The data suggests that increasing the average inference count per episode improves the success rate for both Wan2.1 and SVD methods. Wan2.1 appears to be a more effective method overall, achieving higher success rates than SVD at each inference count level. The steeper increase in SVD's success rate at higher inference counts may indicate that SVD benefits more from increased inference counts than Wan2.1, although it still remains below Wan2.1's performance.