## Chart: Loss vs. Training Tokens (Log Scale)
### Overview
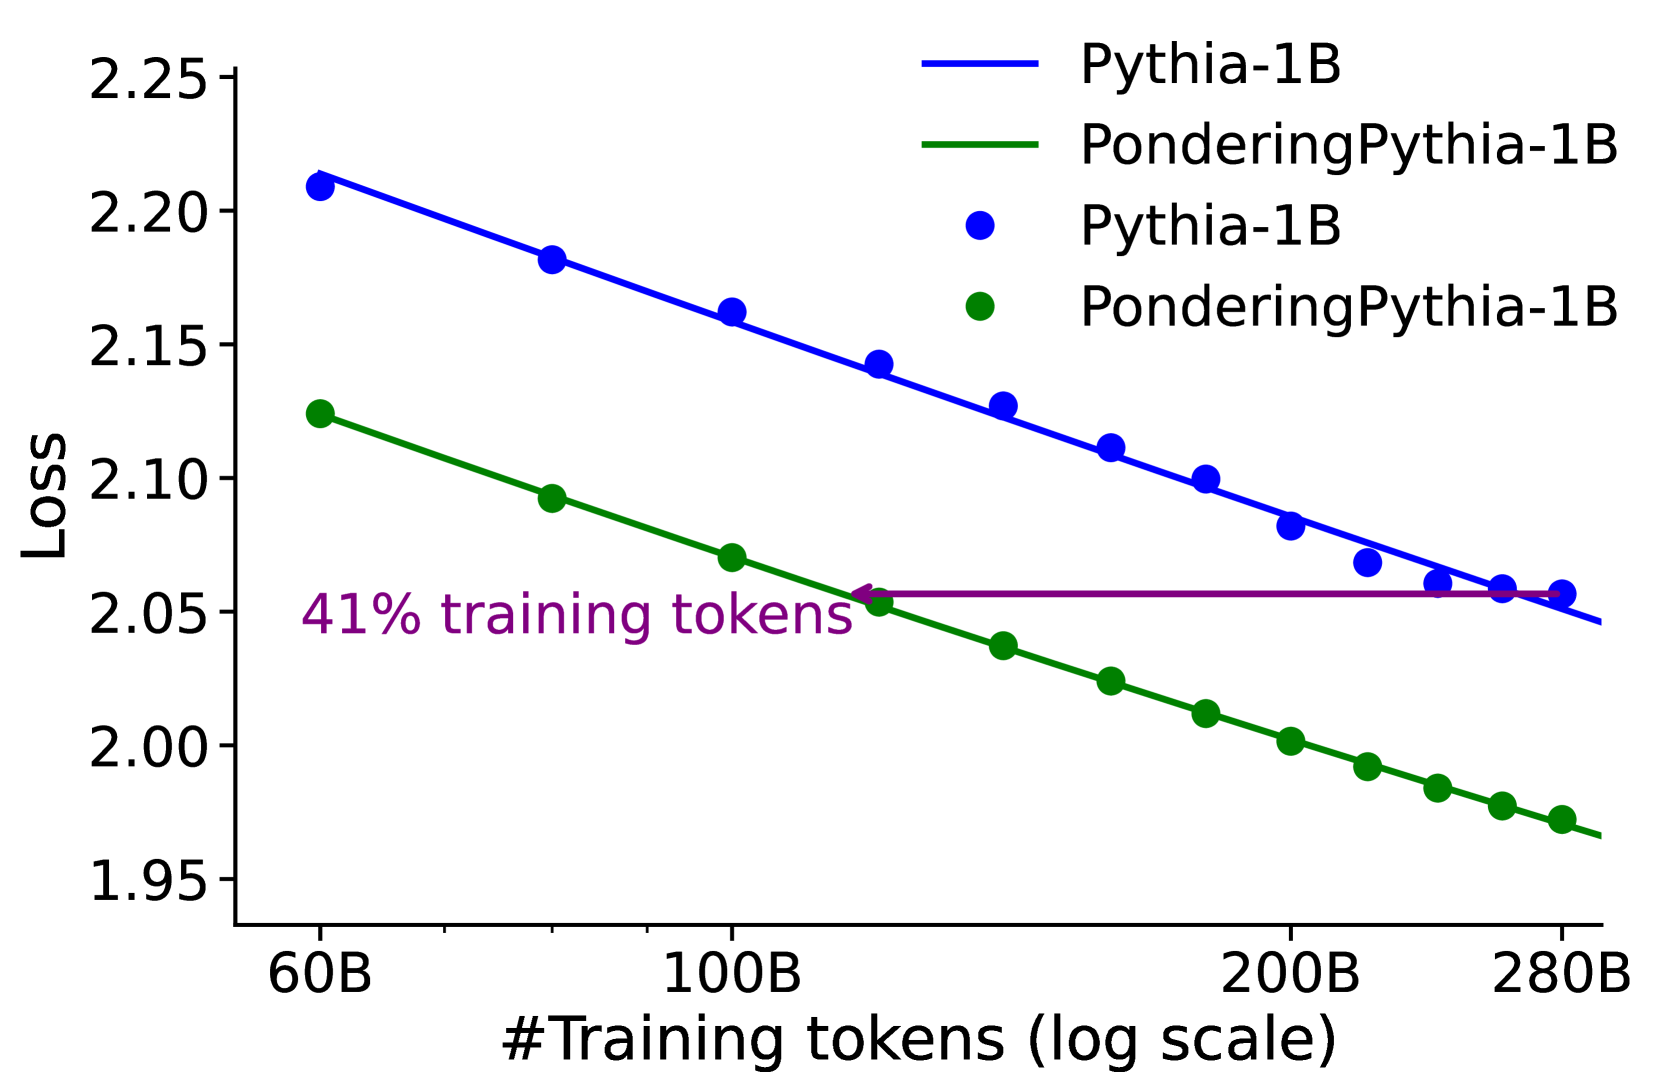
The image is a line chart comparing the loss of two models, "Pythia-1B" and "PonderingPythia-1B", as a function of the number of training tokens (on a log scale). The chart also includes a horizontal line indicating the loss achieved by "PonderingPythia-1B" after 41% of the training tokens.
### Components/Axes
* **X-axis:** "#Training tokens (log scale)". The axis is marked with values 60B, 100B, 200B, and 280B.
* **Y-axis:** "Loss". The axis is marked with values 1.95, 2.00, 2.05, 2.10, 2.15, 2.20, and 2.25.
* **Legend (top-right):**
* Blue line: Pythia-1B
* Green line: PonderingPythia-1B
* Blue dots: Pythia-1B
* Green dots: PonderingPythia-1B
* **Annotation:** "41% training tokens" (purple text with a purple horizontal line).
### Detailed Analysis
* **Pythia-1B (Blue):** The blue line represents the loss of the Pythia-1B model. The line slopes downward, indicating a decrease in loss as the number of training tokens increases.
* At 60B tokens, the loss is approximately 2.21.
* At 100B tokens, the loss is approximately 2.17.
* At 200B tokens, the loss is approximately 2.11.
* At 280B tokens, the loss is approximately 2.06.
* **PonderingPythia-1B (Green):** The green line represents the loss of the PonderingPythia-1B model. The line slopes downward, indicating a decrease in loss as the number of training tokens increases.
* At 60B tokens, the loss is approximately 2.12.
* At 100B tokens, the loss is approximately 2.09.
* At 200B tokens, the loss is approximately 1.99.
* At 280B tokens, the loss is approximately 1.97.
* **41% training tokens (Purple):** The purple horizontal line indicates the loss achieved by PonderingPythia-1B at 41% of the total training tokens. The line intersects the green line at approximately 100B tokens and a loss of approximately 2.06.
### Key Observations
* Both models show a decrease in loss as the number of training tokens increases.
* PonderingPythia-1B consistently has a lower loss than Pythia-1B for the same number of training tokens.
* The annotation indicates that PonderingPythia-1B achieves a certain loss level (approximately 2.06) at 41% of the total training tokens.
### Interpretation
The chart demonstrates the relationship between the number of training tokens and the loss of two language models. The downward trend of both lines suggests that increasing the number of training tokens improves the performance of both models, as indicated by the reduction in loss. The fact that PonderingPythia-1B consistently outperforms Pythia-1B suggests that the "pondering" mechanism is effective in reducing loss. The annotation highlights the efficiency of PonderingPythia-1B, showing that it achieves a certain level of performance with significantly fewer training tokens compared to the total amount used. This could imply that PonderingPythia-1B learns more effectively or requires less data to reach a comparable level of performance.