\n
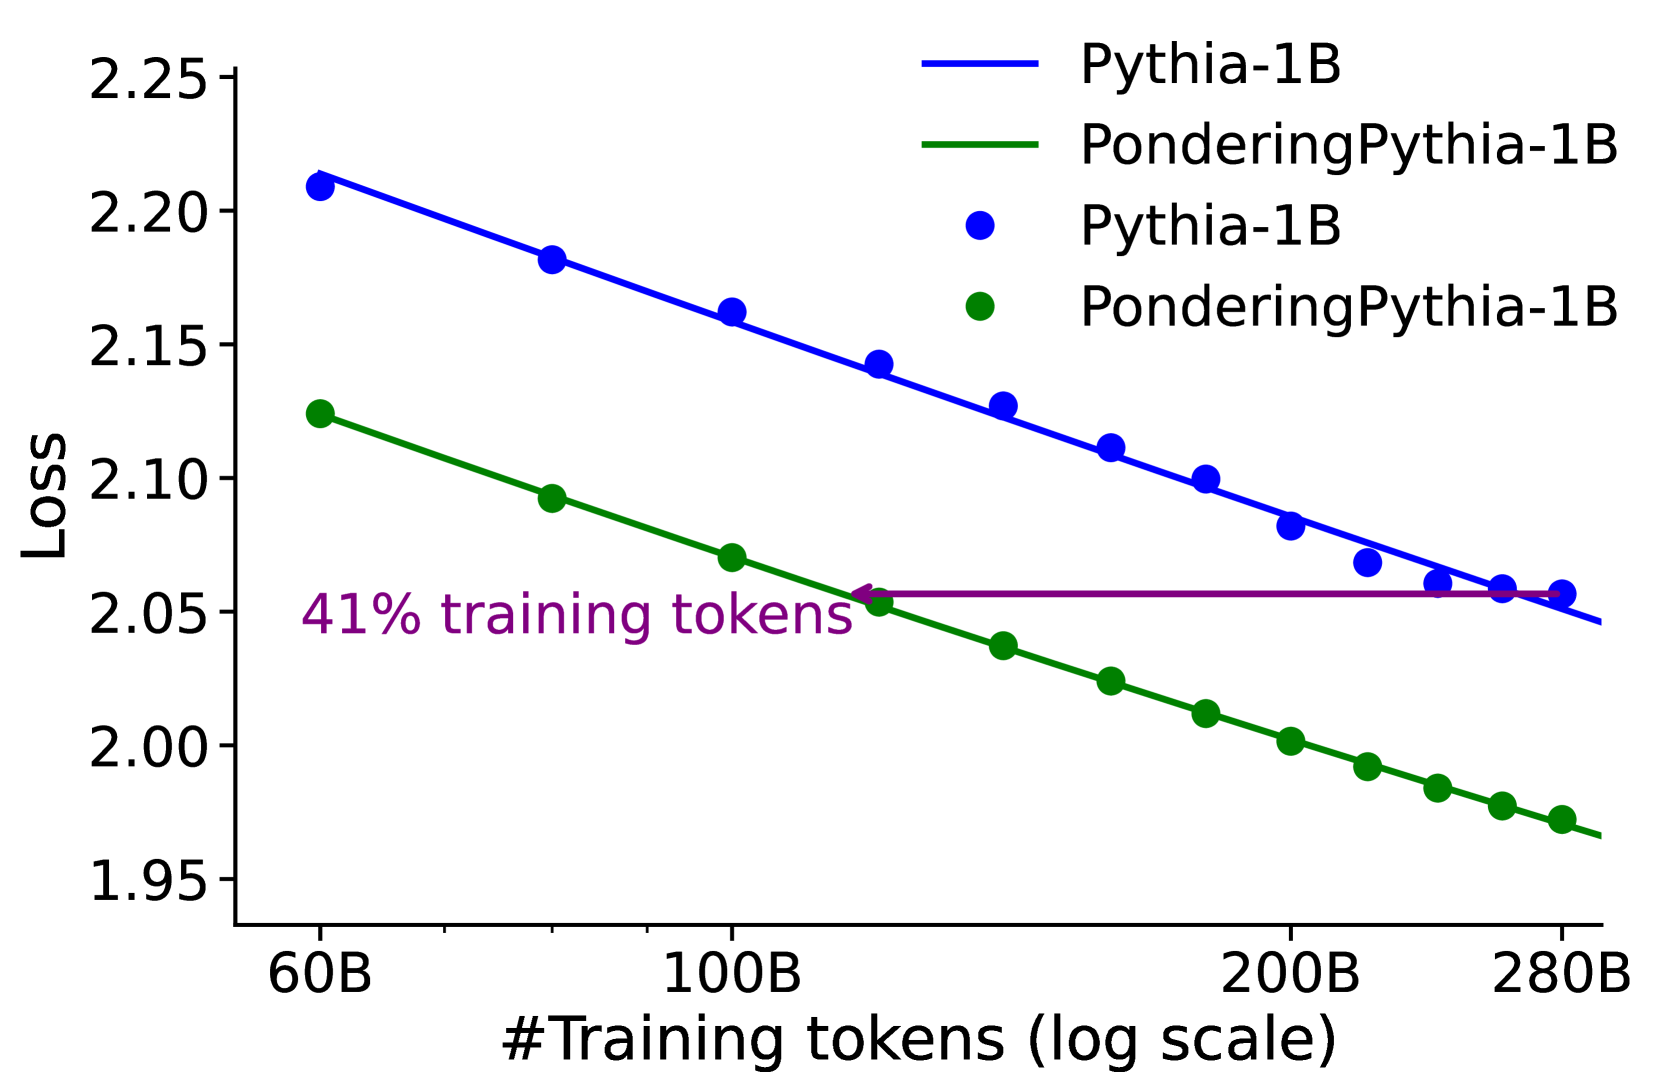
## Line Chart: Loss vs. Training Tokens for Language Models
### Overview
This chart displays the loss function values for two language models, Pythia-1B and PonderingPythia-1B, as a function of the number of training tokens. The x-axis represents the number of training tokens on a logarithmic scale, while the y-axis represents the loss. The chart shows how the loss decreases as the models are trained with more tokens. A horizontal line at approximately 2.05 indicates a point of comparison, labeled "41% training tokens".
### Components/Axes
* **X-axis:** "#Training tokens (log scale)". The scale ranges from approximately 60B to 280B tokens. The axis markers are 60B, 100B, 200B, and 280B.
* **Y-axis:** "Loss". The scale ranges from approximately 1.95 to 2.25. The axis markers are 1.95, 2.00, 2.05, 2.10, 2.15, 2.20, and 2.25.
* **Legend:** Located in the top-right corner.
* Blue line: "Pythia-1B"
* Gray line: "PonderingPythia-1B"
* Blue circles: "Pythia-1B"
* Green circles: "PonderingPythia-1B"
* **Annotation:** "41% training tokens" is written horizontally near the gray line, at a loss value of approximately 2.05.
### Detailed Analysis
**Pythia-1B (Blue Line & Circles):**
The blue line representing Pythia-1B slopes downward, indicating a decrease in loss as the number of training tokens increases.
* At 60B tokens: Loss ≈ 2.21
* At 100B tokens: Loss ≈ 2.16
* At 200B tokens: Loss ≈ 2.11
* At 280B tokens: Loss ≈ 2.07
**PonderingPythia-1B (Green Line & Circles):**
The green line representing PonderingPythia-1B also slopes downward, but is steeper than the blue line, indicating a faster decrease in loss.
* At 60B tokens: Loss ≈ 2.12
* At 100B tokens: Loss ≈ 2.06
* At 200B tokens: Loss ≈ 2.00
* At 280B tokens: Loss ≈ 1.96
The horizontal line at approximately 2.05 serves as a reference point. PonderingPythia-1B crosses this line at approximately 100B tokens, while Pythia-1B crosses it at approximately 200B tokens.
### Key Observations
* PonderingPythia-1B consistently exhibits lower loss values than Pythia-1B across all training token counts.
* The rate of loss reduction is greater for PonderingPythia-1B, suggesting it learns more efficiently from the training data.
* Both models demonstrate diminishing returns in loss reduction as the number of training tokens increases, as the slope of the lines becomes less steep at higher token counts.
* The "41% training tokens" annotation suggests a specific point of comparison or evaluation within the training process.
### Interpretation
The chart demonstrates the impact of training data size on the performance of two language models. PonderingPythia-1B consistently outperforms Pythia-1B, indicating that the "Pondering" mechanism (whatever that may be) contributes to more effective learning. The logarithmic scale on the x-axis highlights the importance of initial training stages, where loss reduction is most significant. The diminishing returns observed at higher token counts suggest that there is a point beyond which adding more training data yields progressively smaller improvements in model performance. The annotation "41% training tokens" could represent a point where the models have reached a certain level of convergence or a specific evaluation milestone. The difference in loss between the two models suggests that PonderingPythia-1B may be more robust or generalize better to unseen data.