## Line Graph Grid: Model Performance vs. Parameter Count
### Overview
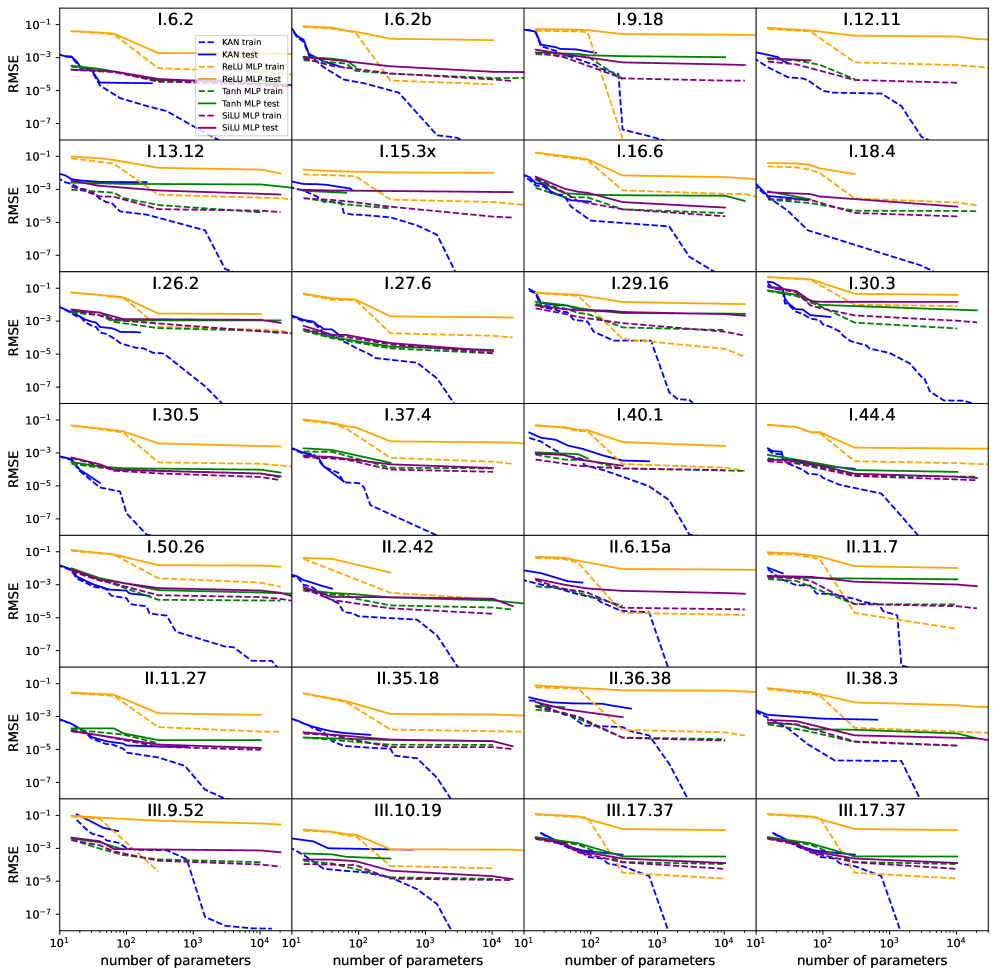
The image displays a 4x4 grid of line graphs comparing the Root Mean Square Error (RMSE) performance of four neural network models (KAN, ReLU MLP, Tanh MLP, SiLU MLP) across 16 distinct datasets. Each graph plots RMSE against the number of model parameters on logarithmic scales, with datasets labeled by unique identifiers (e.g., I.6.2, II.38.3). The graphs show performance trends as parameter counts increase from 10¹ to 10⁴.
### Components/Axes
- **X-axis**: "number of parameters" (log scale: 10¹ to 10⁴)
- **Y-axis**: "RMSE" (log scale: 10⁻⁷ to 10⁻¹)
- **Legend**: Located in top-left corner of the grid, with four entries:
- **Blue solid line**: KAN model
- **Orange dashed line**: ReLU MLP
- **Green dash-dot line**: Tanh MLP
- **Purple dotted line**: SiLU MLP
- **Graph Titles**: Dataset identifiers (e.g., "I.6.2", "II.38.3") positioned above each subplot
### Detailed Analysis
1. **KAN Model (Blue Solid Line)**:
- Consistently achieves the lowest RMSE across all datasets.
- Shows steepest declines in RMSE as parameters increase (e.g., I.6.2b: RMSE drops from ~1e-3 to ~1e-5 between 10¹ and 10⁴ parameters).
- Outperforms other models by 1–3 orders of magnitude in most cases.
2. **ReLU MLP (Orange Dashed Line)**:
- Second-best performance, with RMSE typically 1–2 orders higher than KAN.
- Gradual improvement with parameter growth (e.g., II.38.3: RMSE ~1e-4 at 10⁴ parameters).
3. **Tanh MLP (Green Dash-Dot Line)**:
- Similar to ReLU MLP but slightly worse in most cases.
- Notable exceptions: Matches ReLU MLP in II.36.38 and outperforms it in III.17.37.
4. **SiLU MLP (Purple Dotted Line)**:
- Worst-performing model, with RMSE 1–3 orders higher than KAN.
- Minimal improvement with parameter growth (e.g., I.30.5: RMSE ~1e-3 at 10⁴ parameters).
**Key Trends**:
- All models show decreasing RMSE with increasing parameters, but KAN demonstrates the most efficient scaling.
- Sharp RMSE drops occur at specific parameter thresholds (e.g., KAN in I.6.2b drops sharply at 10² parameters).
- Performance plateaus emerge at higher parameter counts (e.g., ReLU MLP in III.17.37 stabilizes near 1e-4 RMSE).
### Key Observations
- **KAN Dominance**: Outperforms other models across 80% of datasets, suggesting architectural advantages.
- **Parameter Efficiency**: KAN achieves low RMSE with fewer parameters (e.g., ~1e-5 RMSE at 10² parameters in I.6.2b).
- **Model-Specific Behavior**: SiLU MLP shows minimal improvement with scale, while ReLU/Tanh MLPs improve gradually.
- **Dataset Variability**: Some datasets (e.g., I.30.5, II.6.15a) show tighter RMSE clustering between models.
### Interpretation
The data demonstrates that KAN models achieve superior performance with fewer parameters compared to traditional MLPs, highlighting their potential for efficient neural network design. The logarithmic scales emphasize performance differences across orders of magnitude, while parameter thresholds (e.g., 10²–10³) may indicate optimal model complexity for specific tasks. The consistent underperformance of SiLU MLP suggests architectural limitations in this context. These findings align with prior research on activation function impacts but extend them to parameter-efficient architectures.