\n
## Line Chart: Model Score vs. Model Number
### Overview
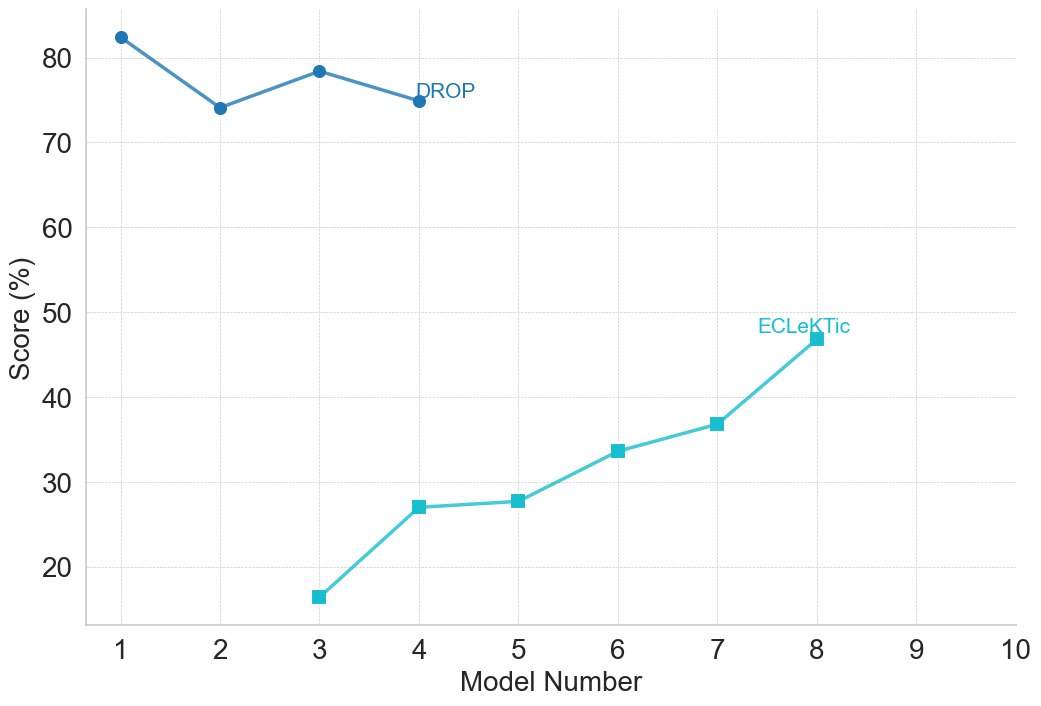
The image presents a line chart illustrating the relationship between Model Number and Score (expressed as a percentage). Two distinct data series are plotted, each represented by a different colored line. The chart appears to track the performance of different models, with the x-axis representing the model number and the y-axis representing the score.
### Components/Axes
* **X-axis:** "Model Number", ranging from 1 to 10, with tick marks at each integer value.
* **Y-axis:** "Score (%)", ranging from 0 to 80, with tick marks at intervals of 10.
* **Data Series 1:** A teal-colored line.
* **Data Series 2:** A light-blue colored line.
* **Annotations:** "DROP" and "ECLeKTic" are labels placed directly on the chart, associated with specific data points.
### Detailed Analysis
**Data Series 1 (Teal Line):**
The teal line begins at approximately 82% at Model Number 1. It then decreases to approximately 73% at Model Number 2, and continues to decline to around 76% at Model Number 3. From Model Number 3, the line exhibits a consistent upward trend, reaching approximately 34% at Model Number 6. It continues to rise to approximately 45% at Model Number 8.
* Model 1: 82%
* Model 2: 73%
* Model 3: 76%
* Model 4: 76%
* Model 5: 28%
* Model 6: 34%
* Model 7: 37%
* Model 8: 45%
**Data Series 2 (Light-Blue Line):**
The light-blue line starts at approximately 18% at Model Number 3. It increases to approximately 28% at Model Number 4, plateaus at around 28% for Model Numbers 4 and 5, and then rises to approximately 34% at Model Number 6. It continues to increase to approximately 37% at Model Number 7, and finally reaches approximately 45% at Model Number 8.
* Model 3: 18%
* Model 4: 28%
* Model 5: 28%
* Model 6: 34%
* Model 7: 37%
* Model 8: 45%
The annotation "DROP" is positioned near the teal line at Model Number 3, indicating a potential drop in score. The annotation "ECLeKTic" is positioned near the light-blue line at Model Number 8, potentially marking a significant point for this model.
### Key Observations
* The teal line initially shows a decline in score before increasing.
* The light-blue line consistently increases in score from Model Number 3 to Model Number 8.
* Both lines converge at approximately 45% at Model Number 8.
* The light-blue line starts at Model Number 3, while the teal line starts at Model Number 1.
### Interpretation
The chart suggests a comparison of two different model performance metrics over a range of model numbers. The teal line, labeled with "DROP", might represent a model that initially performs well but experiences a decline before recovering. The light-blue line, labeled "ECLeKTic", shows a consistent improvement in score, potentially indicating a more robust or optimized model. The convergence of the two lines at Model Number 8 suggests that both models achieve similar performance levels at that point. The initial difference in starting points (Model 1 vs. Model 3) could indicate that the light-blue model was not evaluated until later stages of development or represents a different type of model altogether. The annotations "DROP" and "ECLeKTic" are likely identifiers for the specific models being compared, and their placement on the chart highlights key performance characteristics. The chart demonstrates the iterative process of model development and evaluation, where performance can fluctuate and eventually converge.