# Technical Document Extraction: Line Chart Analysis
## 1. Labels and Axis Titles
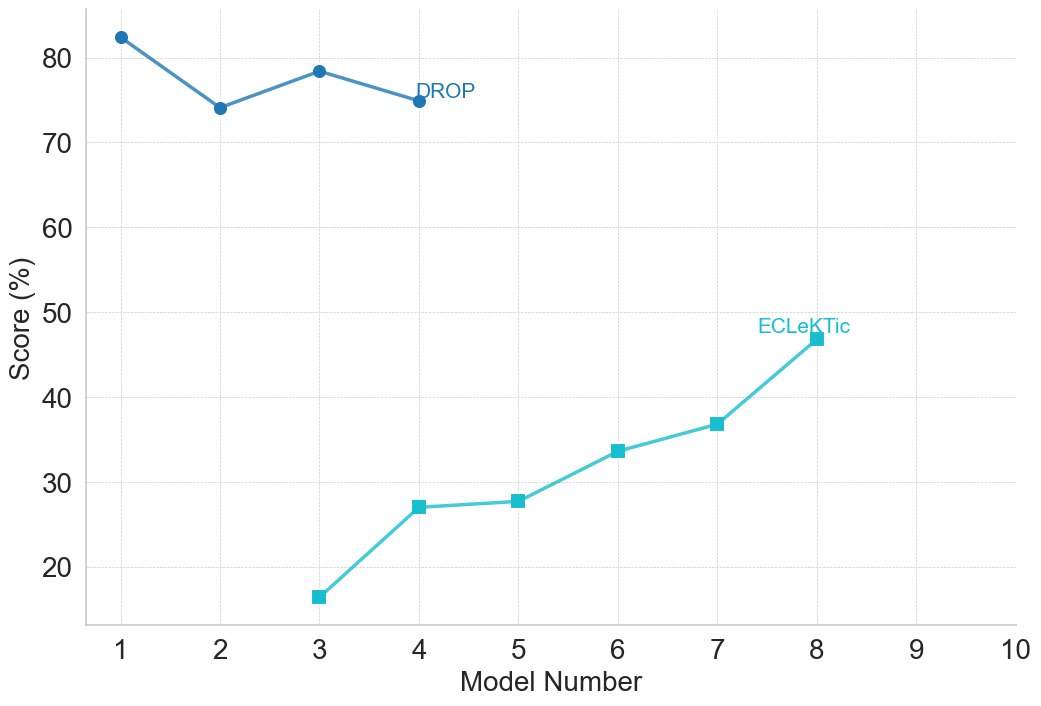
- **X-Axis**: Labeled "Model Number" with integer markers from 1 to 10.
- **Y-Axis**: Labeled "Score (%)" with percentage markers from 0 to 80 in increments of 20.
- **Legend**: Located in the upper-right corner of the chart.
## 2. Legend Details
- **DROP**: Represented by **blue circles** (color: `#1f77b4`).
- **ECLeKTic**: Represented by **teal squares** (color: `#2ca02c`).
- **Spatial Grounding**: Legend positioned at the top-right quadrant of the chart.
## 3. Data Series and Trends
### Series 1: DROP (Blue Circles)
- **Trend**: Initial decline followed by stabilization.
- **Data Points**:
- Model 1: 82%
- Model 2: 74%
- Model 3: 78%
- Model 4: 75%
- **Visual Confirmation**: Line slopes downward from Model 1 to 2, then upward to Model 3, and downward again to Model 4.
### Series 2: ECLeKTic (Teal Squares)
- **Trend**: Steady upward trajectory.
- **Data Points**:
- Model 3: 16%
- Model 4: 27%
- Model 5: 28%
- Model 6: 34%
- Model 7: 37%
- Model 8: 47%
- **Visual Confirmation**: Line ascends consistently from Model 3 to 8.
## 4. Key Observations
- **DROP** scores are consistently higher than **ECLeKTic** across overlapping models (3–4).
- **ECLeKTic** shows significant growth starting at Model 3, surpassing 40% by Model 8.
- No data points exist for Models 5–10 in the DROP series beyond Model 4.
## 5. Additional Notes
- **No embedded text** or secondary languages detected.
- **No data tables** or heatmaps present; the chart focuses on two distinct trends.
- **Axis limits**: Y-axis capped at 80%, though DROP's Model 1 score (82%) exceeds this bound.
## 6. Final Validation
- All legend colors match line markers (blue for DROP, teal for ECLeKTic).
- Spatial grounding of legend confirmed in upper-right quadrant.
- Trends and data points cross-verified against visual slopes.